Jezek5's FX Trading Journal.

Re: Fiber

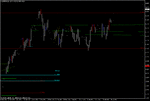
4600 in sight,after that 4955 is what the magic chart is saying,
nice solid PA.
The other chart is how things looked 10 days ago,how lucky is that?
Looks like we're getting a bit ahead of things,could really do with
slowing down a bit,a day or two backing and filling would be good.

Backing and filling it is then.
 
All going to plan so far,
just a couple of levels left
to go on the down side,sitting at one
of them right now.

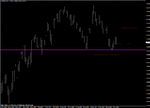
So it bounced at the level it was sitting on,
it could just rollover right here,i'm seeing some resistence
or if it where to run a little higher i think the level i've marked
should cap this up move.
 

Attachments

  • p2.gif
    p2.gif
    18.7 KB · Views: 136
Re: Aussie.

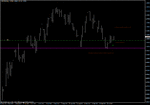
Looking for the Aussie to hold this level 1.0700
and to push back up again.
Top side target 1.1800, i know that sounds crazy
but thats what my charts say.
Looking to buy.

Link posted May the 5th.we've been as low as 1.0387.
I haven't been trading the Aussie,that's a shame,
looking at todays chart we're just at a breakout point,
next stop 1.1800.
 

Attachments

  • p2.gif
    p2.gif
    15.8 KB · Views: 132
Re: Cable

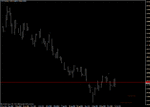
It didn't pullback and i didn't bloody get in,
would buy around 6280 to 6320 depending on PA
on the hourly chart.

Just getting down to the buy zone,would like to
see what price does if we can get to 6300,
not buying yet but the down move is slowing.
 

Attachments

  • p2.gif
    p2.gif
    18 KB · Views: 141
So it bounced at the level it was sitting on,
it could just rollover right here,i'm seeing some resistence
or if it where to run a little higher i think the level i've marked
should cap this up move.

Rolled over at the very first touch of my sell zone,
is that all you've got Dollar?
 

Attachments

  • p2.gif
    p2.gif
    18.9 KB · Views: 160
Re: Cable

It didn't pullback and i didn't bloody get in,
would buy around 6280 to 6320 depending on PA
on the hourly chart.

Took today off so missed all the fun,got right down to where
i was looking to buy,never mind,i'd rather miss a trade than
loose money in a trade any day,i said i'd be watching the hourly
PA,just look at that chart,it doesn't get much clearer than that...bugger.
 

Attachments

  • p1.gif
    p1.gif
    16.2 KB · Views: 125
  • p2.gif
    p2.gif
    18.2 KB · Views: 132
Re: Fiber

4600 in sight,after that 4955 is what the magic chart is saying,
nice solid PA.
The other chart is how things looked 10 days ago,how lucky is that?
Looks like we're getting a bit ahead of things,could really do with
slowing down a bit,a day or two backing and filling would be good.

Two days of backing and filling and up we bounce again.
 

Attachments

  • p7.gif
    p7.gif
    24.9 KB · Views: 125
Rolled over at the very first touch of my sell zone,
is that all you've got Dollar?

So here we are back up at the test zone,
daily close will be very interesting.
 

Attachments

  • p2.gif
    p2.gif
    19 KB · Views: 147
Fiber.

I haven't posted this chart in a while,all these lines are months old
oh look,we're almost back down to that bloody 4145 number again,
didn't think we'd come back down to here without going a bit higher first.
 

Attachments

  • p2.gif
    p2.gif
    21.4 KB · Views: 150
Blows the dust and cobwebs off of this place .
Fiber weekly.
Just playing an inside bar of an inside bar,
for me this up trend is still intact as long as we keep
getting weekly closes above 2750ish.
Weekly chart.
 

Attachments

  • w1.gif
    w1.gif
    27.1 KB · Views: 131
Fiber Daily.

The green 50% acted as a great buy level on the first pullback,
price got just over 50% back up and some selling has come in,
I have to say I'm bullish this pair although i was shorting today,
a close tonight around 2900 could keep this thing bullish.
 

Attachments

  • w2.gif
    w2.gif
    32.2 KB · Views: 142
Just a quick explanation as to how i trade in case anyone bothers
to read my journal.
I use the weekly and daily charts to give me levels to work with,
they give me a clue if i should be buying dips or selling rips,
most of my trades are taken on the 5 min.
 
Todays 5 min chart.

Clear as mud,i missed the first move down but
got in after the pullback.
 

Attachments

  • w3.gif
    w3.gif
    25.2 KB · Views: 159
S&P Daily.

Looking like its going to post a big down day bar,
the green line has been on this chart for 2 weeks and
has acted as good support before,any close above 1430
keeps this chart looking bullish to me,but i would rather
see closes above that green line though.
 

Attachments

  • pe15.gif
    pe15.gif
    26.3 KB · Views: 149
Looney Daily.

For me this looks to be rolling over,daily closes around or below 9800
open up the chance to retest the lows at 9600.
I'm looking to sell spikes above 9800 but would need to reassess if
we blew through 9850.
 

Attachments

  • w4.gif
    w4.gif
    18 KB · Views: 150
Aussie Daily.

Looking to buy Aussie around 1.0200 for a run at 1.0400,
i would be bullish on this pair until we get a daily close
below 1.0100,stops would be very tight on any trade though.
 

Attachments

  • w5.gif
    w5.gif
    19.5 KB · Views: 151
Re: Aussie Daily.

Looking to buy Aussie around 1.0200 for a run at 1.0400,
i would be bullish on this pair until we get a daily close
below 1.0100,stops would be very tight on any trade though.

I didn't put an order in at 1.0200 which was the lowest printed price
so not sure if it would have been filled.
So I ended up chasing it,not the best way i guess but its a free ride now,
need to clear and hold 1.0300,i know,stating the bleeding obvious.
 

Attachments

  • w7.gif
    w7.gif
    19.3 KB · Views: 146
Re: Looney Daily.

For me this looks to be rolling over,daily closes around or below 9800
open up the chance to retest the lows at 9600.
I'm looking to sell spikes above 9800 but would need to reassess if
we blew through 9850.

Just gone short at 9840,stop at 9872,really not sure about this one though.
 

Attachments

  • w8.gif
    w8.gif
    19.2 KB · Views: 154
Back
Top