You are using an out of date browser. It may not display this or other websites correctly.
You should upgrade or use an alternative browser.
You should upgrade or use an alternative browser.
isatrader
Senior member
- Messages
- 2,964
- Likes
- 135
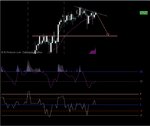
BG Group Exit - Jun 11 Spread
Closing Trade
Entry Price: 1420.35
Exit Price: 1470.10
Percentage Gain: 3.50%
Account Percentage Gain: 0.61%
Daily Keltner Channel Captured: 25%
Trade Grade: B
Exit Reason
Weekly candlestick pattern is a bearish harami, looks like a reversal of short term trend to me and expect it to retest the 1415 breakout level. If it looks like it's going to pivot there, then I will get back in as I like this as a long term play.
isatrader
Senior member
- Messages
- 2,964
- Likes
- 135
Thanks, but the BG Group trade was in a lot better position last week. It has pulled back 100 points this week, but it didn't reach my target of 1600, but it got very close, so probably should have taken profits earlier. I need to work on my exits and come up with a consistent strategy for them on these short term trades as with this one one I let an A+ trade turn into a B grade trade.
Thanks for the effort isa. Have a good un.
Slippery, I'm intrigued by your DAX methods, are you able to give an indication of how your account/performance is doing YTD?
Cheers
isatrader
Senior member
- Messages
- 2,964
- Likes
- 135
Account Update
It was an interesting week this week. I've started to focus more on FTSE 350 stocks that are under 1500, as they fit much better with my risk management strategy on my small account. However, the one problem I'm finding is that a lot of them aren't very liquid, so I'm going to research US stocks in more detail in the coming week to see if they have more liquidity in the same price range so I can broaden my daily search a bit.
I made a few mistakes this week which meant I ended up having a losing week, when it should have been a profitable one.
1. I held onto a position in Talvivaara Mining that had reached my short term target and was an A grade trade and let it turn into a losing F grade trade by holding onto it through it's annual results.
2. I was greedy. BG Group blew out of it's 3 ATR channel on Monday to reach 1595, 5 points short of my target, and it ended the day down with a bearish pin bar. I chose not to take profits and then let it slide all week and finally closed it on Friday for a reasonable 3.50% profit. Which is good, and as SlipperyC said a profit is a profit, but I gave 2/3rds of that profit back. So it felt bad, like when you are winning a football game 4-0 and then end up drawing 4-4. You haven't lost, but it feels like you have.
Anyway, I need to learn from my mistakes which is why I do this journal, so that I can identify them and scrutinize where I went wrong.
The group thread I've been doing has been helping me to develop my short term strategy. Average True Range (ATR) is becoming a key part of my strategy as it helps me to set realistic goals and to see when a trade is going offside. Looking at the daily and weekly ATR I can see how much a stock moves in an average week and then try and catch a portion of it, typically between 1 and 2 ATR seems to be a good target to aim for.
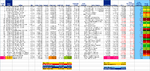
Closed Positions
Talvivaara Mining Rolling Spread: -1.62%
Talvivaara Mining Rolling Spread: -3.75%
BG Group Jun 11 Spread: +3.50%
Open positions
Barclays Jun 11 Spread: +5.51%
GKN Plc Jun 11 Spread: -2.08%
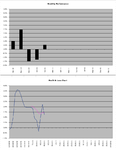
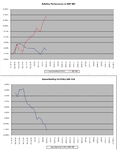
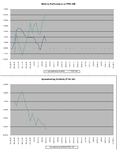
Performance
My SB Account
Week: -1.00%
YTD: -0.74%
S&P 500
Week: 1.04%
YTD: 6.79%
FTSE 100
Week: 0.33%
YTD: 3.10%
It's the last full week of February next week so my aim is to have my first profitable month this year. I'm currently up +0.54% for February, so I'd like to add the 1% I lost this week back onto that and have a strong finish to the month and catch up with the indexes as they continue to outperform.
Have a good week everyone.
Attached is the trades spreadsheet and performance charts
It was an interesting week this week. I've started to focus more on FTSE 350 stocks that are under 1500, as they fit much better with my risk management strategy on my small account. However, the one problem I'm finding is that a lot of them aren't very liquid, so I'm going to research US stocks in more detail in the coming week to see if they have more liquidity in the same price range so I can broaden my daily search a bit.
I made a few mistakes this week which meant I ended up having a losing week, when it should have been a profitable one.
1. I held onto a position in Talvivaara Mining that had reached my short term target and was an A grade trade and let it turn into a losing F grade trade by holding onto it through it's annual results.
2. I was greedy. BG Group blew out of it's 3 ATR channel on Monday to reach 1595, 5 points short of my target, and it ended the day down with a bearish pin bar. I chose not to take profits and then let it slide all week and finally closed it on Friday for a reasonable 3.50% profit. Which is good, and as SlipperyC said a profit is a profit, but I gave 2/3rds of that profit back. So it felt bad, like when you are winning a football game 4-0 and then end up drawing 4-4. You haven't lost, but it feels like you have.
Anyway, I need to learn from my mistakes which is why I do this journal, so that I can identify them and scrutinize where I went wrong.
The group thread I've been doing has been helping me to develop my short term strategy. Average True Range (ATR) is becoming a key part of my strategy as it helps me to set realistic goals and to see when a trade is going offside. Looking at the daily and weekly ATR I can see how much a stock moves in an average week and then try and catch a portion of it, typically between 1 and 2 ATR seems to be a good target to aim for.
Closed Positions
Talvivaara Mining Rolling Spread: -1.62%
Talvivaara Mining Rolling Spread: -3.75%
BG Group Jun 11 Spread: +3.50%
Open positions
Barclays Jun 11 Spread: +5.51%
GKN Plc Jun 11 Spread: -2.08%
Performance
My SB Account
Week: -1.00%
YTD: -0.74%
S&P 500
Week: 1.04%
YTD: 6.79%
FTSE 100
Week: 0.33%
YTD: 3.10%
It's the last full week of February next week so my aim is to have my first profitable month this year. I'm currently up +0.54% for February, so I'd like to add the 1% I lost this week back onto that and have a strong finish to the month and catch up with the indexes as they continue to outperform.
Have a good week everyone.
Attached is the trades spreadsheet and performance charts
Attachments
Hi Leo,
Thanks for your interest, although I don't think there's anything special about my trading methods.
I base my decisions on 3 support/resistance levels that I mark on 5min/15min/60min charts at the beginning of each day. They are based on my own interpretation of s/r levels formed by just looking at the charts on daily/4hr/60min timescales. [edit] I usually trade anywhere between £2 - £10 / point depending on the 'feel' of the situation.
When price approaches one of these levels I look at my two other custom indicators based on Bollinger distance and combined CCI's. I strive to keep charts as clutter free as possible because I personally think it helps me recognise patterns more effectively (one of my strengths).
However, I also add other 'action area's' into the mix based on open, high and low of day, intraday s/r + potential trend start lines.
A few years ago I used to trade individual shares and base my decisions more on fundamental analysis but I got 'killed' so many times buying shares that I thought were bargains or shorting shares I thought were overpriced only to see them move opposite to what I thought, stop me out then proceed in the 'correct' direction! I switched to indices (and fx /gold) because of the liquidity, volatility and extended trading. Plus, I just need to watch for patterns rather than read through rafts of news and reports.
The last, difficult, ingredients are experience, patience, discipline and persistence. Over the last 9 years I've lost what I would describe for me as a LOT (>£15K) of money trying to do this, trying to prove to myself that I can. Realistically perhaps I should have given up years ago, but I'm still drawn to it.
Thankfully over the last couple of years I started to improve and become (usually!) consistently profitable. But I'm still extremely good at ambushing myself and losing money by failures of discipline and patience. These were/are the two hardest things for me to master.
I tend to over complicate things when I have losing runs by adding new indicators to charts, over analysing potential positions and [EDIT] my two biggest failings; trading against the trend and OVERTRADING! This last bit will end up killing me!!
Anyway, at the end of the day I'm just a 'blunt instrument' as regarding trading - I mean there's no elegance in hitting sell at a high and buy at a low!
As for performance, my year is January to December. I had around £4,500 (not a big fish ;-() in my sb accounts (I use IG, GEKKO, PADDY and Smartlive for the MT4 platform) at the beginning of Jan and usually aim for around £200-300 per week rather than a fixed percentage - the pounds seem to have more emotional traction with me!! So far, I've got around £6,100.
Hope that answers everything!
Last edited:
Hi isa,
Thats a good, honest appraisal of your trades. They aren't nice lessons to learn but hopefully once learned they won't be forgotten.
I used to be wildly optimistic with my profit targets but gradually (through experience and reading blogs like Electronic Local (http://electroniclocal.blogspot.com/), Steenbarger (http://traderfeed.blogspot.com/) and the School of Trade blog (http://www.sidewaysmarkets.com/) I began to aim for closer, more realistic targets.
SlipC
isatrader
Senior member
- Messages
- 2,964
- Likes
- 135
Hi isa,
Thats a good, honest appraisal of your trades. They aren't nice lessons to learn but hopefully once learned they won't be forgotten.
Thanks, and for the links, I haven't seen them before. I think what I trying to decide is what kind of trader am I. Can I run multiple strategies in one account, or should I separate them and have two or three accounts all doing different strategies. For example on this account I'm thinking maybe I should only be running short term positions that are closed each week, but also I like to trade medium term swings, so maybe I should open another account and to play them separately. Is something I need to think more about.
Personally I'd go for the separate accounts.
I've tried running long-term and short-term positions in one account and what happens is, if the price goes against my positions I'll tend to close the long-term position as well as the short-term instead of letting the long-term one ride the volatility. Making it a separate account means a couple of extra steps are needed if I need to close a long-term position.
I've tried running long-term and short-term positions in one account and what happens is, if the price goes against my positions I'll tend to close the long-term position as well as the short-term instead of letting the long-term one ride the volatility. Making it a separate account means a couple of extra steps are needed if I need to close a long-term position.
Hi Leo,
Thanks for your interest, although I don't think there's anything special about my trading methods.
I base my decisions on 3 support/resistance levels that I mark on 5min/15min/60min charts at the beginning of each day. They are based on my own interpretation of s/r levels formed by just looking at the charts on daily/4hr/60min timescales. [edit] I usually trade anywhere between £2 - £10 / point depending on the 'feel' of the situation.
When price approaches one of these levels I look at my two other custom indicators based on Bollinger distance and combined CCI's. I strive to keep charts as clutter free as possible because I personally think it helps me recognise patterns more effectively (one of my strengths).
However, I also add other 'action area's' into the mix based on open, high and low of day, intraday s/r + potential trend start lines.
A few years ago I used to trade individual shares and base my decisions more on fundamental analysis but I got 'killed' so many times buying shares that I thought were bargains or shorting shares I thought were overpriced only to see them move opposite to what I thought, stop me out then proceed in the 'correct' direction! I switched to indices (and fx /gold) because of the liquidity, volatility and extended trading. Plus, I just need to watch for patterns rather than read through rafts of news and reports.
The last, difficult, ingredients are experience, patience, discipline and persistence. Over the last 9 years I've lost what I would describe for me as a LOT (>£15K) of money trying to do this, trying to prove to myself that I can. Realistically perhaps I should have given up years ago, but I'm still drawn to it.
Thankfully over the last couple of years I started to improve and become (usually!) consistently profitable. But I'm still extremely good at ambushing myself and losing money by failures of discipline and patience. These were/are the two hardest things for me to master.
I tend to over complicate things when I have losing runs by adding new indicators to charts, over analysing potential positions and [EDIT] my two biggest failings; trading against the trend and OVERTRADING! This last bit will end up killing me!!
Anyway, at the end of the day I'm just a 'blunt instrument' as regarding trading - I mean there's no elegance in hitting sell at a high and buy at a low!
As for performance, my year is January to December. I had around £4,500 (not a big fish ;-() in my sb accounts (I use IG, GEKKO, PADDY and Smartlive for the MT4 platform) at the beginning of Jan and usually aim for around £200-300 per week rather than a fixed percentage - the pounds seem to have more emotional traction with me!! So far, I've got around £6,100.
Hope that answers everything!
thanks Slippery, very interesting. You seem to be doing okay so far this year, a nice 35% growth in 2 months is damn good! £4.5k is reasonable fish in my book, my Mrs won't let me trade more than a £1k at the moment until I prove myself and we pay off the mortgage...! I've only done 1 year of "live" trading so far so I think it's a good thing my Mrs keeps me in check...! my plan is to hopefully grow a £1k, then add another £1k cash to it and so on to grow my trading pot (with a bit of luck!).
It would be an interesting comparison to compare how yourself, isatrader and I do over this year using our varying methods. With a variation of day trading for yourself, to short-term shares mixed with some longer ones for isatrader, to my purely medium term share trading methods...
Cheers!