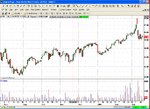
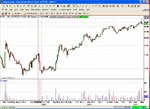
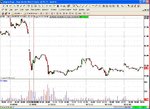
Right, I'll start by simply posting up some of the basic quantitative data, prior to any analysis. This stock was chosen not at random, but because, 1.....it represents a sector that is topical, viz. Energy, and 2......all is not what it would seem with this stock.
Sales 119.80 Mil
Income 21.50 Mil
Net Profit Margin 17.90%
Return on Equity 10.80%
Debt/Equity Ratio 0.97
Revenue/Share 6.76
Earnings/Share 1.22
Book Value/Share 11.19
Dividend Rate 0.00
Payout Ratio 0.00%
Current P/E Ratio 12.5 15.0 20.1
P/E Ratio 5-Year High NA 21.9 64.8
P/E Ratio 5-Year Low NA 6.2 16.9
Price/Sales Ratio 2.25 1.97 1.54
Price/Book Value 1.36 2.59 2.89
Price/Cash Flow Ratio 3.80 7.40 12.70
Gross Margin 83.6 49.2 47.3
Pre-Tax Margin 12.4 20.9 11.5
Net Profit Margin 17.9 13.4 7.7
5Yr Gross Margin (5-Year Avg.) 86.2 43.0 47.4
5Yr PreTax Margin (5-Year Avg.) 6.4 17.1 9.4
5Yr Net Profit Margin (5-Year Avg.) 4.2 10.2 5.8
Debt/Equity Ratio 0.97 0.51 1.20
Current Ratio 0.7 1.1 1.5
Quick Ratio 0.4 0.8 1.0
Interest Coverage 1.7 10.0 3.5
Leverage Ratio 2.3 2.3 6.0
Book Value/Share 11.19 13.29 12.52
Return On Equity 10.8 17.7 14.6
Return On Assets 4.7 7.6 2.5
Return On Capital 5.5 11.6 6.6
Return On Equity (5-Year Avg.) 2.1 16.1 12.0
Return On Assets (5-Year Avg.) 0.8 6.3 2.0
Return On Capital (5-Year Avg.) 0.9 9.8 5.6
Income/Employee 247,000 55,000 26,000
Revenue/Employee 1 Mil 410,000 336,000
Receivable Turnover 9.6 7.8 7.4
Inventory Turnover NA 10.0 8.4
Asset Turnover 0.3 0.6 0.3
Income Statement - Sales.... EBIT.... Depreciation... Total Net Income... EPS...... Tax Rate (%)
12/04........................... 119.8...... 34.9........... 50.1................... 21.5 ...................1.22 ............NA
12/03............................ 73.7........ 20.9 ..........35.8.................. -18.2.................. -1.42 ............NA
12/02 ............................67.1........ 23.6.......... 30.9.................. -1.7..................... -0.22............ NA
12/01............................ 61.8 ........15.6 ..........19.4................... 1.8 ......................0.04............ 35.70
12/00............................ 58.1........ 27.4.......... 17.6................... 12.5 ....................0.80 ............34.20
12/99............................ 37.1........ 10.2.......... 15.2................... 2.6 ......................0.01............ 35.00
12/98............................ 35.6....... -44.0.......... 20.4................. -30.8.................. -4.17............. NA
12/97............................ 42.1........ 14.6.......... 17.4................... 8.4...................... 0.88............ 33.30
12/96............................ 25.8 ........5.7 ............10.2 ...................5.5 ......................0.45 .............1.90
12/95 ............................23.2........ 2.7 ............10.7 ...................1.1 ......................0.14............. 0.00
..................Book Value/ Share Debt/ Equity Return on Equity (%) Return on Assets (%) Interest Coverage
12/04.......... ...$11.26.......... 0.97 ...........................10.8 ..................................4.7..........................1.7
12/03.............. $9.57........... 1.61........................... NA.................................... -3.7........................ 0.7
12/02............ $10.14.......... 1.76........................... NA..................................... -0.4........................ 0.9
12/01............ $10.99 ..........1.10........................... 1.2...................................... 0.5........................ 1.2
12/00............ $10.23.......... 0.98........................... 9.2...................................... 4.1......................... 3.3
12/99 ............$10.25.......... 0.81.......................... 2.1....................................... NA .........................1.6
12/98............ $10.33.......... 0.93.......................... NA..................................... -17.0........................ NA
12/97............ $14.47.......... 0.53.......................... 7.4...................................... 4.4.......................... 7.3
12/96............ $12.32.......... 0.32.......................... 7.1...................................... 4.6 ..........................19.7
12/95............ $13.05.......... 0.00.......................... 1.5...................................... 1.3.......................... 1.6
Balance Sheet - 10 Year Summary (in Millions) Current Assets Current Liabilities Long Term Debt Shares Outstanding
12/04.............................................................................. 28.1 ....................41.1..............192.4.... 17.6 Mil
12/03.............................................................................. 85.8 ....................120.6........ 214.9....... 13.9 Mil
12/02 ..............................................................................17.3 .....................16.6 .........248.3 ........13.9 Mil
12/01............................................................................. 13.0 ......................59.5 .........161.7........ 13.4 Mil
12/00............................................................................. 22.5...................... 21.4......... 134.0........ 13.3 Mil
12/99............................................................................. 41.0...................... 20.5 .........100.3........ 12.1 Mil
12/98 .............................................................................14.2...................... 13.1 ..........78.3 .........8.2 Mil
12/97 .............................................................................28.5...................... 15.8 ..........60.3 .........7.9 Mil
12/96............................................................................. 20.8 ......................16.0.......... 24.7......... 6.3 Mil
12/95............................................................................. 12.8....................... 8.1............ 0.1........... 5.8 Mil
a) Restricted cash was used to pay off 2004 Senior Subordinated Notes
on January 8, 2004 which are included in long-term debt including
current maturities above.
Production and Price Information: Three Months Twelve Months
--------------------------------- Ended Ended
December 31, December 31,
--------------- ---------------
......... 2004 2003 2004 2003
------- ------- ------- -------
Production:
Oil (MBbls) 381 128 1,736 268
Gas (MMcf) 2,462 2,950 11,387 12,315
Total Production (MMcfe) 4,751 3,718 21,801 13,923
Average daily (MMcfe) 51.6 40.4 59.6 38.1
Average prices:
Oil ($/Bbl) $25.44 $29.28 $28.71 $28.72
Gas ($/Mcf) $6.27 $5.15 $6.15 $5.36
Gas equivalent ($/Mcfe) $5.29 $5.09 $5.50 $5.29
Operating revenues:
Oil and gas sales $25,139 $18,938 $119,802 $73,697
--------- --------- --------- ---------
Operating expenses:
Lease operating expenses 5,246 3,298 22,308 11,301
Depreciation, depletion and
amortization ..............10,995 7,484 47,453 28,253
General and administrative 1,919 1,009 8,758 4,713
Accretion expense .........845 670 3,400 2,884
Loss on mark-to-market
commodity derivative
contracts .................(237) 200 1,371 535
Year-End 2004 Proved Reserves. The company also announced that it ended 2004 with proved reserves of 72.6 billion cubic feet of natural gas and 19.7 million barrels of oil, or 191 billion cubic feet of natural gas equivalent (Bcfe).
At December 31, 2004, the company's independent petroleum engineers estimated the present value of these reserves, excluding income taxes, using Securities and Exchange Commission (SEC) pricing guidelines for year-end 2004 and discounted at 10%, to be $613 million. Using the SEC guidelines, realized prices averaged $6.51 per thousand cubic feet of natural gas and $36.72 per barrel of oil.
NATCHEZ, Miss.--(BUSINESS WIRE)--March 15, 2005--Callon Petroleum Company (NYSE:CPE - News; NYSE:CPE.PrA - News) announced today that its Board of Directors authorized quarterly dividends to be paid April 15, 2005 to shareholders of record on March 31, 2005 of its $2.125 Preferred Stock, Series A.
The dividend will be $0.53125 per share.
Financial data in U.S. dollars
Media General Industry: Independent Oil & Gas
As I said this was not a random choice, and I will post why this is not as clear cut as it looks.
Cheers d998


