Intraday Trading the Forex market to make consistent profit

EJ

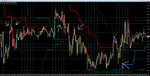
From approx 8 30 pm UK time - LR structure on EJ as changed now - no longer all 3 longer term LRs saying down - as 2 have crossed

But with out 25 and 37 - supports can still be tested and if broken - structure will allo price to fall under 140 00

If supports hold and more Lrs go under price and price makes over 25 - stays above say 140 -10 / 15 - then it might try 37 + and higher


Regards


F
 
Hi TRO

i have attached the EJ 1 min LR chart - showing an an example - 4 scalps using the 3 white quick Lrs in 4 time windows today

The time approx is from 2 30 pm UK time to just past 4 30 pm UK - ie just prior to London close.

I have marked 2 scalp sells and 2 scalp buys - which basically are worth 71 pips net in that time.

No i did not take all 4 - as was out for 2 - not at desk

I have shown the detail in this chart - which is easily lost when I post a 1 min chart showing an 8 hr or 14 hr period

The 3 quick whites are the low numbers up to 45 - and in the general LR structure - with the 3 main long term ones still saying no buy atm - as mentioned before - we need over 25 and 37 to be looking at a larger turn up now

Remember you need to programme in - all the LRs a shown along with the 9 min time windows - as they are also key for short term intraday both way trades

I think you would admit - 71 pips available in an average 2 hr period with all 4 trades having RR's of over 2 - in fact 2 over 4. is pretty good

The devil is in the detail - ie within the structure - thats why I have so much confidence to scalp in both directions

ie a trend for me is any move above 3+ pips - although I dont really want to chase 3-5 pips - 7 -25+ pips are my forte

Hope this helps

Lr colours mentioned on earlier post - i am used to this set up - but it whats comfortable to the trader .

I took me over a year of 1 min Lrs charts to fully understand them - but nowadays I understand all structures - but of course - will never be 100% accurate

Regards

F


My observations regarding your chart...

Doesn't look like the thick solid green line or green dotted line is used in these trades.

Price and 3 white LR lines needs to be over the red line and yellow line to sell and under to buy.

Red line over yellow line to sell... Red line under yellow line to buy.

Buy after 2 white dashed lines cross above solid white line... Sell after 2 white dashed lines cross below solid white line.

The indicator will highlight when these conditions are present.

Thanks F
 
Last edited:
My observations..

Doesnt look like the thick solid green line is used.

Price needs to be over the red line to sell and under to buy.


The thick green Lr was useful for me at 10 30 - 45 am UK time this morning - crossed under green dotted to confirm longer sell and structure change - and then about 10 hrs + later at 8 30 - 9 pm tonight - when it crossed back above green dotted - saying structure is changing again the supports at 140 00 - 140 10 might now hold

Every LR as a connection to another one on price structure

The fast 3 are for scalping - both ways

The 3 middle Lrs - red - yellow - green - are 1hr - 2 hr session bias

The 3 longer Lrs - are more session bias for 2 - 4 + hrs or even days on larger ralllies of over a few hundred pips

This set up is unique to a 1 min chart

On a 5 min or 15 min or hr - different longer term view - but not so accurate for intraday trading.

Just gone 11 pm Uk time - so off to bed in next 10 mins - as up early for EO - but hope its starting to make sense

PS - dont forget time windows that need to line up with LR crosses and new trades etc etc


Regards


F
 
Last edited:
gbpusd-m1-forex-capital-markets.png


Coded a trigger indicator...

condition 1: Red line LR95 over yellow line LR180 to sell... Red line under yellow line to buy.

condition 2: Price and 3 white LR 15/25/45 lines needs to be over the red line LR95 and yellow line LR180 to sell and under to buy.

condition 3: Buy after 2 white dashed lines LR 15/25 cross above solid white line LR 45... Sell after 2 white dashed lines cross below solid white line.

Looks like it is working!!

Do I have it, F??
 
Hi TRO

i have attached the EJ 1 min LR chart - showing an an example - 4 scalps using the 3 white quick Lrs in 4 time windows today

The time approx is from 2 30 pm UK time to just past 4 30 pm UK - ie just prior to London close.

I have marked 2 scalp sells and 2 scalp buys - which basically are worth 71 pips net in that time.

No i did not take all 4 - as was out for 2 - not at desk

I have shown the detail in this chart - which is easily lost when I post a 1 min chart showing an 8 hr or 14 hr period

The 3 quick whites are the low numbers up to 45 - and in the general LR structure - with the 3 main long term ones still saying no buy atm - as mentioned before - we need over 25 and 37 to be looking at a larger turn up now

Remember you need to programme in - all the LRs a shown along with the 9 min time windows - as they are also key for short term intraday both way trades

I think you would admit - 71 pips available in an average 2 hr period with all 4 trades having RR's of over 2 - in fact 2 over 4. is pretty good

The devil is in the detail - ie within the structure - thats why I have so much confidence to scalp in both directions

ie a trend for me is any move above 3+ pips - although I dont really want to chase 3-5 pips - 7 -25+ pips are my forte

Hope this helps

Lr colours mentioned on earlier post - i am used to this set up - but it whats comfortable to the trader .

I took me over a year of 1 min Lrs charts to fully understand them - but nowadays I understand all structures - but of course - will never be 100% accurate

Regards

F

174658d1400015962-intraday-trading-forex-market-make-consistent-profit-ej-4-scalps-13514.jpg


The last buy is NOT the same because of where the white dotted LRs crossed the solid white.

The first sell has the solid white LR still rising.

These trades seem more subjective than objective. Perhaps, there is more than one entry trigger... cross over of LRs OR all 3 LRs turning positive - is that the case? I can code that.

This is my OBSERVATION after studying the chart for a while and it is NOT in anyway, shape or form a CRITICISM. As a programmer and trader, I am looking to establish discrete entry rules.

Thanks again, F.

that will be challenging for a discretionary system
 
The more rules that can be stated clearly, the more the indicator can do.

The purpose of the indicator is to scan for trade opportunities based on the conditions.

eurusd-m1-fxdirectdealer-4.png


AUDJPY is where next opportunity may occur...
 
gbpusd-m1-fxdirectdealer.png


F:

It appears that when all 3 white LRs turn positive, that is a possible entry.

Your thoughts, please.

Thanks.
 
F:

You have posted about time windows. I am not 100% sure of the correct settings.

Would you please specify the exact start/ending time of each time window so I can code the indicator correctly?

Thank you.
 
F:

You have posted about time windows. I am not 100% sure of the correct settings.

Would you please specify the exact start/ending time of each time window so I can code the indicator correctly?

Thank you.


Hi Tro

OK time windows happen for 36 minutes out of every 60 mins of chart time

So lets start say at 8 00 am UK time - so that first 9 min window is to 8 09am

8 21 am ( 9 mins from 30 min change) next starts

8 30 am - mid way - 9 mins later at 8 39 am - window stops again

8 51 am ( 9 mins to new hr change ) start of new time window

So every hr or 60 mins - there are 6 important times for changes - ie

Next hr would be same - ie 9 00 am - then 9 09 am - then 9 21 am then 9 30 am then 9 39am then 9 51am

A move can carry on through time windows - ei

Let say a buy on EU at 9 09 am - and 9 21am still rising - 9 30 am still rising - 9 39 am stops and reverses

Another example - 9 51 am a buy slows down or stalls

10 00 am peaked or just stalling now

10 09 am new sell trade - and that trade may last just 12 mins to 10 21am or may go on all the way to 11 00 am and stop

So time windows are the times to look for interim highs or lows and changes in movements.

My best scalps stop on the hr change - and by 9 mins past i am looking at scalp buying ors selling and before the half hr change to exit with 10 -25+ pips.

You normally dont get 2 trades every hr on just one pair - but some hrs you might have none - just price continuation - other hrs - even 3 changes - each one over 10 pips

Hope that helps

Will check out other info you need after tea and post later


Regards


F
 
Especially if you could analyse just one trade with a in-zoomed chart from entry to exit, that would be great.

Regards

sunZy

Thanks a lot F. It was exactly the thing i wanted to see. Thanksthanks.
Your last posts are really helpfully especially the ones with pictures and descriptions.


I would love to see pictures please

Jep. You will get it. Couldn´t deliver it faster, had university and than training.
 
Hi Tro

OK time windows happen for 36 minutes out of every 60 mins of chart time

So lets start say at 8 00 am UK time - so that first 9 min window is to 8 09am

8 21 am ( 9 mins from 30 min change) next starts

8 30 am - mid way - 9 mins later at 8 39 am - window stops again

8 51 am ( 9 mins to new hr change ) start of new time window

So every hr or 60 mins - there are 6 important times for changes - ie

Next hr would be same - ie 9 00 am - then 9 09 am - then 9 21 am then 9 30 am then 9 39am then 9 51am

A move can carry on through time windows - ei

Let say a buy on EU at 9 09 am - and 9 21am still rising - 9 30 am still rising - 9 39 am stops and reverses

Another example - 9 51 am a buy slows down or stalls

10 00 am peaked or just stalling now

10 09 am new sell trade - and that trade may last just 12 mins to 10 21am or may go on all the way to 11 00 am and stop

So time windows are the times to look for interim highs or lows and changes in movements.

My best scalps stop on the hr change - and by 9 mins past i am looking at scalp buying ors selling and before the half hr change to exit with 10 -25+ pips.

You normally dont get 2 trades every hr on just one pair - but some hrs you might have none - just price continuation - other hrs - even 3 changes - each one over 10 pips

Hope that helps

Will check out other info you need after tea and post later


Regards


F

Thanks, that answers my question.

gbpusd-m1-forex-capital-markets.png


Will post a video or 2 about this method and the indicators I wrote soon...
 
For MM: I have everything else disabled so you can just focus on the main thing.

Like i said, the TurtleTraderChannel ist the one with changing blue to red (20) with small gold (5). The green one is a normal Donchian 55.


It needs to change colours and than the first break of the golden line to search for entries. The first arrow is a fakey and should be stoped breakeven if possible.
Second one is in the timezone and the two candels are exactly 20p so there should be at least 10p in the pocket.

Third one is again a fakey but it is pre german DAX opening. So no trading there.
The fourth is good. Nice entry, run of 20p a pullback and than again down.

The fifth and the last one is again a good entry point. Higher high, pullback with a higher low.


That picture is from yesterday evening - today and like you can see its a range of <50p the whole 2 days. It´s a trendfollowing idea, so in a range it could not work like in a nice trend but for a 45p range it would be a nice >30p.

If you have questions, just ask.
 

Attachments

  • T2W MM.jpg
    T2W MM.jpg
    1.4 MB · Views: 209
Top