I have found the Holy Grail indicator for the Dow Jones - 100% right so far

Batsonar.

It's good that you take a cautious approach; I reckon there are many people who blow their account, and then just start again after a period of time thinking they were just 'unlucky' last time. But I am intrigued why you pay for indicators but don't use them for your own purposes?
Good question. I have always had a fascination for technical analysis and searching for the "Holy Grail" indicator. Its a bit of a hobby for me. The platform I use, has indicators that are based on volume with some indicators being invented and implemented by this company with patent technologies. I think the Platinum service costs about $108. I Had the Gold service for a time. I can't remember how much that was, but one day I decided to cancel my service. I emailed the company and I got a reply. They said if I didn't cancel, they would give me the Platinum service for $20.95 a month instead of there usual price of $108. I couldn't resist and is excellent value. For the paid indicators on Tradingview I use the EzAlgo V7, EzAlgo SR and the EzOscillator. I pay £36 a month for this package. As I said, this is more of a hobby and like many other people with a hobby sometimes it costs money. I also like to help out my fellow traders like TEAMTRADER who seems to appreciate my signals.
 
This chart is for Tuesday the 9th May 2023. As you can see from my ADS Oscillator it was about to cross the zero line back into the "GREEN" but yesterday and today the indicator fell deeper into the "RED" indicating more selling pressure. Also as you can see on the chart, the DOW is between the support "Pivot Point" (see pink line) and the resistance "Pivot Point" (see blue line). It needs to break one of these to confirm a direction.

SmartSelect_20230509_21103.jpg
 
This is my BATSONAR indicator which measures money flow. As you can see the indicator has crossed the zero line back into the "RED". This is a "SELL" signal which means that the DOW could be about to make a move to the downside in the short-term. However the DOW is sitting right on top of a support "Pivot Point" (see pink line) at 33,522 so any downside could be limited.

SmartSelect_20230509_2327.jpg
 
I would NEVER have traded down today after that opening move upwards!
Trust the signal was my key thought - profit of 139pts.
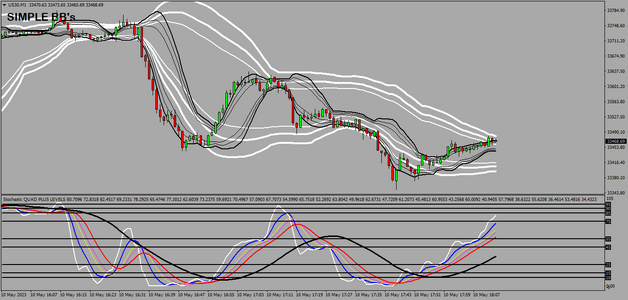
Here is my exit chart.
TEAMTRADER
US30M1 exit1.png
 
If anyone else wishes to follow these signals I have prepared a very easy to follow MT4 'BB' template.
A great set up for BB followers - the trending being easier to recognise as the black BB's enclose the whites and the confirmation comes from the Stochs Quad Indicator.
Template attached.
TEAMTRADER
 

Attachments

The "SELL" signal I gave 2 days ago on Tuesday the 9th May 2023 given by my BATSONAR indicator (money flow), turned out to be correct and the DOW has fallen 252 points in the past 2 days.
 
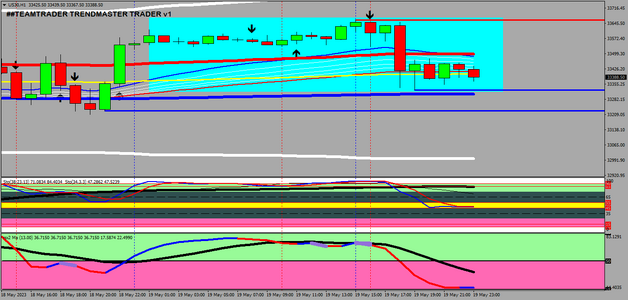
I have a divergence lead low risk 'buy signal' with a 'bottom of chart price' as 33106 - but as it is only on the 15m and 30m charts I will watch and wait tomorrow as the higher timeframes remain as a sell.
TEAMTRADER
 
I have a divergence lead low risk 'buy signal' with a 'bottom of chart price' as 33106 - but as it is only on the 15m and 30m charts I will watch and wait tomorrow as the higher timeframes remain as a sell.
TEAMTRADER
I just went to log into my trading app and it would not let me. I can log into the website no problem but not the app. I was just going to look at my indicators after I saw your last post.
 
TEAMTRADER - I would be careful at the moment buying because my ADS Oscillator is still well in the "RED". Its not anywhere near a "BUY" signal at the moment.
SmartSelect_20230515_140214.jpg
 
This is my ADS Oscillator. As you can see the indicator has crossed the zero line back into the "GREEN". This is a "BUY" signal which means that the DOW could be about to make a move to the upside in the short-term.

SmartSelect_20230518_235322.jpg
 
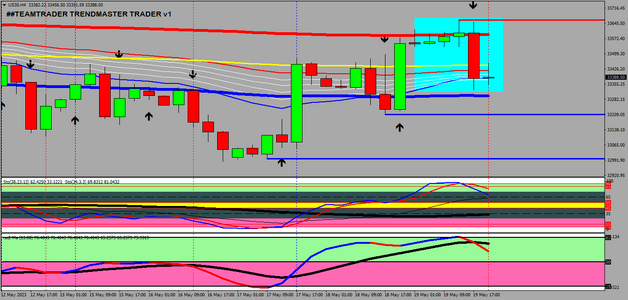
Luckily for me the 4hr and 1hr charts were both o/b so I stayed out.
TEAMTRADER
PS - these were the charts as a close up to show why I did not enter
 

Attachments

  • US30H4 overbought area.png
    US30H4 overbought area.png
    44.9 KB · Views: 14
  • US30H1 overbought area.png
    US30H1 overbought area.png
    39.3 KB · Views: 13
Last edited:
This is my BATSONAR indicator. As you say see the indicator is about to cross the zero line back into the "GREEN". This is a "BUY" signal and could mean that the DOW is about to make a move to the upside in the short-term.

SmartSelect_20230526_224534.jpg
 
Last edited:
Hey TEAMTRADER, I'm about to take over Watchtower and the Governing Body of Jehovah’s Witnesses. I have about 6 elders at the moment that are now fully awake from their Watchtower indoctrination. I have been sending out hundreds of texts messages to the elders offering them 5 million pounds of Watchtower's money if they help take over Watchtower. I have told them to look at my Facebook page JAMES HACCHE and examine the evidence, including the Bible codes, of the overwhelming evidence that I'm am the Son of God, Christ the Messiah the second coming. Hey TEAMTRADER how do you fancy 3 million pounds after I take over Watchtower so that you will be able to trade to your hearts content?
 
Last edited:
However inviting it appears I will have to decline.

Two reasons.

1. I believe that all the money that has been collected should be spent on good causes and particularly the health care of those in this country who are in need.

2. The distribution of that amount of money should be in the hands of a legally recognised and legally appointed committee.

Thanks for the offer nevertheless.

TEAMTRADER
 
  This is my BATSONAR indicator which measures money flow. As you can see, the indicator has crossed the zero line back into the "RED". This is a "SELL" signal which means that the DOW could be about to move to the downside in the short term.

SmartSelect_20230531_230328_MV Chart 2.jpg
 
Back
Top