I think the best thing to happen to forex is trumps return.....it stirs the volatility pot big time
I don't need to predict the direction of usd or any currency....I just need volatility
N
Contrary to NVP, I prefer to have directional not volatile FX. Less stress and more basis points to be had. I use a piece of mathematics I call the Volatility Response Model for FX or vrmfx for short. I am told by the T2W moderator that I cannot point the reader to the thread that describes this method so you will have to search T2W.
Essentially the vrmfx calculates the H/L/C for 1 through 8 days (short term) and 1 through 8 weeks (long term) into the future. The predicted C (close) in the next time period turns out to be the market sentiment over the whole of that next time period. Above C and the market is bullish over that time scale. And below C and the market is bearish over that time scale. Chaos or volatility happens when the market gets trapped in between the vrmfx levels.
The final piece of the puzzle for me resides in the JPY, CAD and CHF currencies. Traders can start with a pot of JPY, CAD and CHF and then proceed to sell these currencies and convert them to EUR, GBP, USD, AUD and NZD and then convert back again to JPY, CAD and CHF.
EUR, GBP, USD, AUD and NZD watch the JPY, CAD and CHF currencies like a hawk looking for the opinions of these currencies for buy and sell signals. Here are the triplets to look at to see which currencies JPY, CAD and CHF prefer.
GBPUSD X USDJPY = GBPJPY
EURUSD X USDJPY = EURJPY
GBPUSD X USDCAD = GBPCAD
EURUSD X USDCAD = EURCAD
GBPUSD X USDCHF = GBPCHF
EURUSD X USDCHF = EURCHF
So the vrmfx says to go look at what the USDJPY, USDCAD and USDCHF are all doing with the USD.
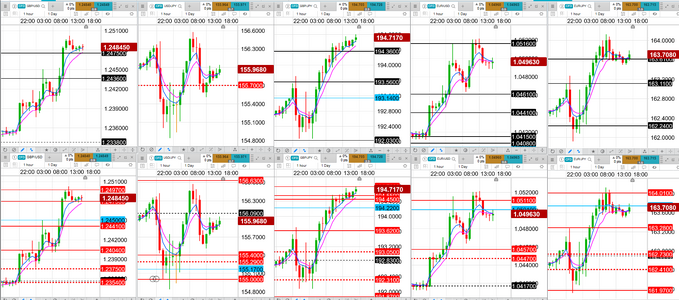
Here is an example for Friday 24th of January just gone with the three sets of charts attached. Chart times are 4 hours behind London. All the three charts attached show weekly vrmfx levels top row and daily vrmfx bottom row for the FX pairs.
The first chart for JPY shows
GBPUSD X USDJPY = GBPJPY
EURUSD X USDJPY = EURJPY
So what happened in these triplets? USDJPY went sideways on the day trapped between the vrmfx levels 156.63 and 155.00. The JPY had no opinion about the USD whether to buy or sell in a trend. So the remaining FX pairs in these two triplets were all bullish. 100+ basis points to be made on the remaining FX pairs.
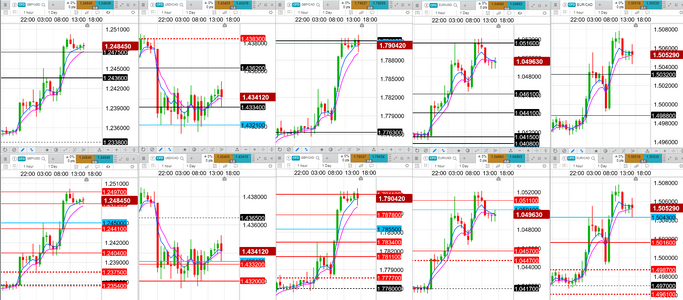
The second chart shows
GBPUSD X USDCAD = GBPCAD
EURUSD X USDCAD = EURCAD
So what happened in these triplets? USDCAD went sideways on the day trapped between the vrmfx levels 1.4383 and 1.4320. The CAD had no opinion about the USD whether to buy or sell in a trend. So the remaining FX pairs in these two triplets were all bullish. 100+ basis points to be made on the remaining FX pairs.
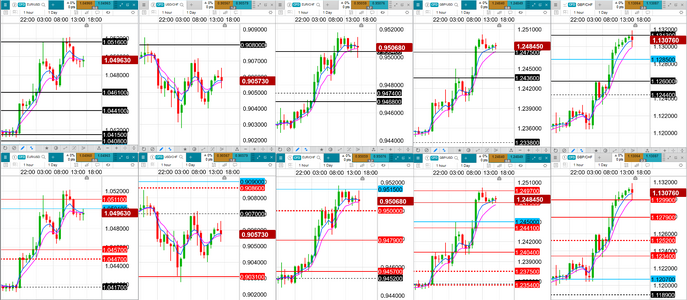
Finally the third chart shows
GBPUSD X USDCHF = GBPCHF
EURUSD X USDCHF = EURCHF
So what happened in these triplets? USDCHF went sideways trapped between the vrmfx levels 0.9070 and 0.9031. The CHF had no opinion about the USD whether to buy or sell in a trend. So the remaining FX pairs in these two triplets were all bullish. 100+ basis points to be made on the remaining FX pairs.
The bottom line for me is, for whatever trading analysis method you use, to go look at USDJPY, USDCAD and USDCHF. And see what their opinion is about the USD. Last Friday JPY, CAD and CHF had no opinion so moved sideways trading USD and had lots of volatility.
For those who like the stress then go trade on the volatility. I prefer to look at the charts every hour to see how the markets are progressing and to understand how the JPY, CAD and CHF see the USD.
gka
P.S. Forgot to mention. The blue-red channel in the three charts attached is the EMA(4,7) channel which should be in all trade platforms. vrmfx levels steer the EMA(4,7) channel.