Nugget 7
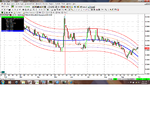
Part of what I believe makes for a successful trading strategy is to have a wherewithal that will allow to determine when a trend is going to reverse or if there is a correction within the trend. Also, so you want to trade the correction, or just wait for it to complete. I mentioned in the previous nugget the way trends can be viewed. After the 5-min chart trends just like the monthly does. The trader needs to be cognizant of the activity on each time frame. Here's a trade I just entered on the EUR/AUD. If you look at my methodology which is the black chart. Notice where the price struggled. That is the 50% mark of the YS1—YS2. (My proprietary levels are available to any who ask.). Also notice how the cloud is descending, and is looking very bearish into the future. The forecast? That's why I like the ichimoku cloud. Price is headed south in the very near future.
For a minute, forget my methodology. After all, this is a thread of ideas. My methodology is not right for all. I just want people to glean what is best for them. Bottom line is, it does not matter what you use to determine the reversal. Just determine it! Afterward, ride it out. It doesn't take too many of these kinds of trades for you to double your account, and that will depend on just how much you use to margin.
Okay, I digressed. The highlight of this nugget goes outside my methodology. An excellent tool that can be used to determine reversals within any time period is the standard deviation. This indicator is actually called the Hurst Bands historic. Not only do they contain the standard deviation (I'll explain more.), but the Hurst (Named after JM Hurst) cyclical decomposition. It shows the path of direction and current momentum of the trend. In other words, look at the daily. Would it not appear the uptrend paddling upstream? What do you think would happen on a reversal? It is going to be a lot easier for this trend to move south with the current, than while it was moving north against the current.
Here's the amazing thing about standard deviations. Take a data set, then apply the SD formula (Which I will give later in this post.). It is a statistical fact that the rule is that 68% of all the data will fall within sigma 1 +/- of the mean. The mean or the median (Mean is the average. Median is the middle number) is the middle line, the thick blue, in this case. 95% of the data falls within the 2. 98% within the 3. And there is still a total of 2% that will find its way beyond the 3. I hope this information is obvious how it adds up in making trading decisions.
It is implied there is a 98% chance of circa 1.4200 being containment. Where will it head once it reverses? The gravitational pull is always to the median. It gets hit 99% of the time once a 2 or 3 has been hit. The thing you must do in trading off the SD charts is to monitor the TF you placed the trade on. This is a daily, at the beginning of the business day, check the chart just to see how close ot the median it has gotten.
Needless to say, it is also best to trade in the direction of the momentous flow. If the chart is pointing south, then it's good to travel south (Better gas mileage that way.) The reason you need to check the charts at the beginning of a new candle is because the SD is dynamic. If the setting is set on 150 candles, then when the 1st one falls off, the 150th is added. This means a new set of data is figured into the equation.
Now for the equation. Apply this to any set of data you wish. Specifically, when you have a favorite market that has trended for a long time, take the previous 100 candles, apply the formula, and see if the numbers do not fall within the parameters given. When you see it has hit sigma 2 get ready for the action in reverse: The sum of the data values (I wish they had the Greek letter sigma on my keyboard.) minus the mean, and then square the result. Afterward divide by the (data values – 1). Once you are done with that, take the square root, and that is you sigma 1 value. The sigma 2 and 3 are equi-distance. A lot of work? Sure! But, we are not talking 5-10 pips per day.


