Hi Grey1,
Great trading!
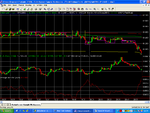
I noticed that there were two VWAP Longs w/RIMM today (after the fact, on my part), one at 14:51-ish (for 0.92 max gain, for apprx 20 min trade), & another at 15.37-ish (for a 0.75 max gain, but would have taken an hour). Gains listed (from MPD risk band to VWAP), trade times in EU, both trades were in O/S (3 TF’s) territory for the INDU & RIMM (perfect O/S conditions).
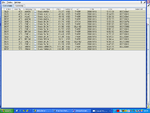
Coincidently, today I took a screen print of the DOW and my Core Stock List MACCI’s at 14:56 (EU). The following MACCI’s were from 14:56:
Dow (in 1,5, & 10 TF’s) were: - 85, -209, & - 69.
RIMM (in 1,5, & 10 TF’s) were: -168, - 143, & -101.
Just a question, which time did you trade RIMM?
Just trying to gain more knowledge & your style of trading. Both RIMM VWAP potential entries were both fantastic opportunities from the bloody (red) opening this morning. I waited for 2.5 hours till the market decline stabilized, since I felt like I would have gone bottom fishing, during this time (had long trades on my mind - wrong thinking). But by this time the market was in Lunch mode, and that's when RIMM made it's largest run (about 400c) till the EOD, with the DOW leading the way (at the same time, starting right at NY's lunch time). fwiw, one of my trading rules is not to trade during lunch, pd the market too many times previously.
NAS