bbmac
Veteren member
- Messages
- 3,584
- Likes
- 789
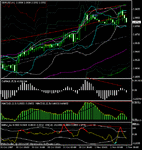
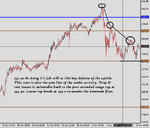
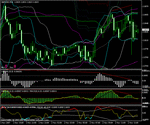
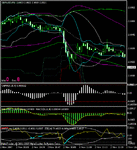
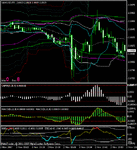
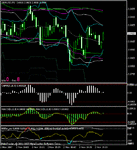
Here is the 1hr chart at that set-up mentioned and shown in posts 59 and 60 above. i'd mentioned there were varying patterns of bearish divergence extending on the 15/30/1hr chart at that resistance. This can indicate that a deeper pullback/reversal is likely, and with the breech of the extreme fib tunnels on those time frames too, this seemed to be the indication. cable is off 76pips from todays highs as I write this.
The 1hr set-up was the srongest divergence being generally regular immediate bearish divergence whilst the 15 and 30min were the lower probability across a sample - regular sequential bearish divergnecs in the oscillators.
The 1hr set-up was the srongest divergence being generally regular immediate bearish divergence whilst the 15 and 30min were the lower probability across a sample - regular sequential bearish divergnecs in the oscillators.

