FX trading Nov05 - Nov09

😀 Haha, yes so far this month it's clearly a short timeframe traders playground on this pair between these well lit markers. The sharp scalpels are certainly drawing blood inside the range.

At least there's a god on the majors front though. Euro/Cable continuing to soundly spank the buck.

What he (supresses) taketh with one hand.... 😉

china talking about loading up on euro's is spanking the dollar, helping asian currencies strengthen , I assume thats the fundamentals for these yen gains this A.M. am 🙂 ? Just seen a clip on Bloomberg.
 
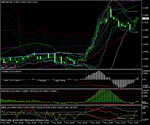
The 15min screenshot attached shows the bullish thrust in cable this morning out of the asian range.
 

Attachments

  • 15min.gif
    15min.gif
    7.7 KB · Views: 136
china talking about loading up on euro's is spanking the dollar, helping asian currencies strengthen , I assume thats the fundamentals for these yen gains this A.M. am 🙂 ? Just seen a clip on Bloomberg.

Yes, that's the general flavor of Cheng's comments. Think he used the term "favoring stronger currencies" but that's enough to spook it.

As if the dollar hasn't got enough playground bullies. They need China's conker bashing like a hole in the head.

I'd love to be a fly on the wall in Paulsons office this week 😆
 
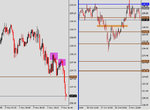
The screenshot is the 5min confirming bearish set-up at top of that 1035-50 resistance zone in cable this morning. The set-up saw a breech too of the fib tunnels to 4hr and stochs were in extreme o/b 90+ readings to 4hr at that level. A nice short with price up 181 from the day's lows extended from it's 5,10 and 20 day average ranges of 122, 114 and 130pips.

MNi talking about offers now at 1070/80 strengthening into a possible option barrier at 1100.

As a matter of interest we exceeded the Yearly R1 pivot at 0951 !! which coincided with the area of Dly r2 pivot at 0954.

(5min Rev Extreme [ii] )
 

Attachments

  • 5min.gif
    5min.gif
    19.1 KB · Views: 136
Yes, that's the general flavor of Cheng's comments. Think he used the term "favoring stronger currencies" but that's enough to spook it.

As if the dollar hasn't got enough playground bullies. They need China's conker bashing like a hole in the head.

I'd love to be a fly on the wall in Paulsons office this week 😆

hmmm, from what I can make of it the U.S. wants the dollar to continue to devalue, lower and lower, how low ? I dont know.... so im sure the US welcome more petrol. I dont know, I mean all these fundamentals and differing views, I can see why some people say bugger it whats the chart doin?

There was another analyst on today she was saying, oil
"well it could go down from here , or it could trade higher. And in the future it depends"

well **** me freddy....... cheers love, very helpful I thought and they pay people for that ? Made me laugh .

Oil hmm love to be there when $100. goes through, its gonna happen, what a buzz ......


dollar bills covered in oil stuffing the turkey this thanksgiving . what an image..
 
On the M1 chart however, it was the macd and not the osma giving a bearish divergence.
So on 5min and 1 min we have a divergence each - and not simultaneous as you have described in yr previous posts.

As i recall, its the osma which is more important in reversal set up. SO which one should we choose ?

Yrs
CT.
 

Attachments

  • m1.gif
    m1.gif
    21.8 KB · Views: 139
This move up in cable exceeded the 223.6 extension of yesterdays range at 1032, the 250% extension coming in at 1059.
 
CT: Yeh it was a hybrid set-up on the 1min trigger, a cross between a Reversal A[ii] with both macd and the cci variant showing the bearish divergence and a Reversal Extreme with osma showing the extreme readings, as shown in screencap attached.


These hybrid set-ups are not ideal but with a Reversal Extreme [ii] on the next time frame up, the 5min intermediate and a reversal extreme on the next up from that the 15min, as well as the longer/trend time frame, the 30min, combined with the other factors mentioned such as breech of fib tunnels to 4hr (incidentally breech of donchian, fib channels and 61.8 res channels to 1hr too) and stochs in extreme o/b territory to 4hr...all at identifiable resistance,...it was a good set-up.
 

Attachments

  • 1min.gif
    1min.gif
    22.3 KB · Views: 149
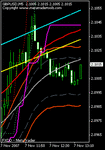
its all about confluence really. Check out my 5min small chart at that entry, showing a breech of the 2nd extreme fib tunnel as well as the donchian (pink) and the fib channels (aqua and yellow) even a breech of the 78.6 fib channel (aqua) which is rare, although often price breecges the 61.8 (yellow.)

Technical trading with indicators is as much about obserbving and understanding the repeating behavioual patterns of those indicators too.
 

Attachments

  • 5min small.gif
    5min small.gif
    7.4 KB · Views: 132
Final post from me for a while.

The 5min screenshot shows the hidden divergence at that Wkly R1, former option barrier/offers area/Dly R3 pivot area...nice place to re-enter long at that potential RBS confluence. MNI had confirmed likely bids there at 1010-0995 area now which was good....
 

Attachments

  • 5min.gif
    5min.gif
    21.4 KB · Views: 147
hmmm, from what I can make of it the U.S. wants the dollar to continue to devalue, lower and lower, how low ?

There was another analyst on today she was saying, oil
"well it could go down from here , or it could trade higher. And in the future it depends"

well **** me freddy....... cheers love, very helpful I thought and they pay people for that ? Made me laugh .

dollar bills covered in oil stuffing the turkey this thanksgiving . what an image..

:cheesy: Hehehe, you crack me up. But yes, I totally agree some of the blurb they kick out is comical/insulting to say the least.

Unless you derive immense pleasure from speed reading (whilst immediately digesting & categorizing) the chatter off the wires, you’ll be best served by simply adhering to the principles of my post (#69) on this thread.

http://www.trade2win.com/boards/showthread.php?t=26988&page=7

You can then pick up the flows via your technicals & choose your favored weapon (strat) based on the day’s/week activity & your particular mood.
 
Knock knock,

aah b****** lets just kick the door in!

Time to think about putting the other hat on & eyeing the lower stops maybe.

See what kind of reaction (pullback - if any) we get around here.
 

Attachments

  • 433b28a.jpg
    433b28a.jpg
    59 KB · Views: 131
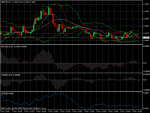
I am long on EUR/USD on little bit mixed signal on My New Trend Indicator
 

Attachments

  • untitled.GIF
    untitled.GIF
    30.9 KB · Views: 150
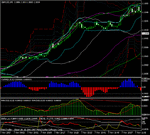
I am milking this Up Trend trade is closed for +15 pips profit....
 

Attachments

  • untitled.GIF
    untitled.GIF
    32.5 KB · Views: 152
Looks like a nice little edge you got developing there Mr.Black, particularly' with trend.'

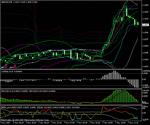
Attached is the 15min gbpusd chart, the white lines showing where most of the price action has occured within that channel as it consolidates just offf the highs at 1070area.
so long as the low of that channel at 1026 holds, any new high could see that 1070-1026 as the new 15min potential RBS zone on any first retest, if the long trend continues.

Very often it is these consolidation areas that can offer strong SBR/RBS potential, particularly where most of the price action occured within them.

Price up 201 pips off the days lows way above it's 5 10 and 20day range averages, and per the point I was making about potential 'against trend' areas, it really becomes a high probability trade (using this uptrend example) if you can identify clear resistance and the following conditions exist

a. Oscillator extremes/divergence readings
b. price is extended well beyond it's average ranges, and particularly if extended beyond it's Daily R2 or S2 pivot as well.
c. Band/channel deviation or any other o/b -or- o/s indication.

Good examples today both at that 2.1035-50 resistance and at the 2.1070-80 area resistance. Both against trend entries but high in probability, the first of which is discussed a few posts back today, in this thread.

Of course if you have a broker that allows you to trade in both directions you can stay 'with trend' and gain too with these high probability pullback/retrace/reversal set-ups.
 

Attachments

  • 15min.gif
    15min.gif
    8.3 KB · Views: 134
Last weeks range of 369pips in gbpusd well above the 5 10 and 20 week averages of 296, 272 and 302pips respectively. this week so far, at time of writing is 289pips [0781-1070.]
 
Knock knock,

aah b****** lets just kick the door in!

Time to think about putting the other hat on & eyeing the lower stops maybe.

See what kind of reaction (pullback - if any) we get around here.


bullish from 237.50/60, see if we get a kick back up.... from here on... testin that ol 37.60, again ? will it close below it? my setup suggests not likely..... early days mind..

go bulls. 🙂
 
Worried about those Asians buying yen tonight , so ive got a few buckets of popcorn in to watch the show , i dont want to be bull standing the wrong way & in front of any stampede. 🙂
 
G/L with above trade C_B.

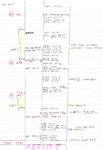
Attached is the Daily support/resistance 'roadmap' I compile at start and update during each session. Well half of it anyway, One page is everything above the Daily pivot, one is everything below. The 4 column approach allows me to record all the significant or potentially significant points in the market, and i can quickly see where the strongest areas of potential supp/res reside. I have posted elsewhere on this site, what is in the 4 columns but it is basically;

Column 1. Dly pivot Dly R and S pivots. Dly Fib s/r zones (a custom proprietary indicator that highlights likely s/r zones.)

Column 2. Current week/mth hi and lo. obvious swing highs and lows on 1hr+ and how many touches (x1, x 2 etc...) Ydays european and U.s hi/lo if not the daily hi/lo.

column 3. note-able previous Daily hi/lo's, fibs, MA's on Daily, Weekly and Monthly pivots, and any note-able areas highlighted in various newsfeeds used.

column 4. Bids/offers reported asian hi/lo.

Seperately i keep a sheet noting the RBS/SBR areas on my intermediate chart + and highlight where they coexist across thne time frames.

Of course this is a lot of detail, but because I look for multiple set-ups across mainly 1 pairing, as opposed to one set-up across multiple pairings, I am able to go into this detail, and the positive corollary of the approach is a deeper knowledge and understanding of the character of the particular pairing, it's idiosyncracies and historical behaviour during certain market events.
 

Attachments

  • scan0001.jpg
    scan0001.jpg
    1.4 MB · Views: 157
Back
Top