FX trading Nov05 - Nov09

(Hi GN)

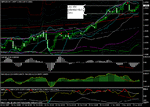
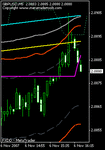
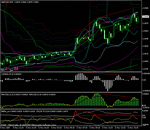
The screenshot shows the 4hr chart gbpusd. You will see that there was a hidden divergence Reentry to trend set-up in that chart's last RBS zone highlighted, at yesterdays lows. Of course if not using the 4hr as a trigger it serves as a confirming set-up to any longs taken around that area.

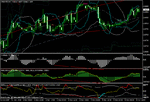
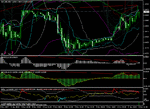
The 2nd screenshot shows the 1hr chart and here too you can see a hidden divergence set-up in that time frames last potential RBS zone which was coexistant with the 4hr.

Notice too how the spinning top 1hr candles on the last part of the move from the highs to yesterdays bottom turned more bullish with the bodies of the tail candles being tested more than the tails as the bulls took over,...a phenomenon alluded to by trader_dante in his thread as being particularly noticable in gbpusd.

(1hr Reentry type 1, 4hr Reentry type 3)
 

Attachments

  • 4hr.gif
    4hr.gif
    23.9 KB · Views: 187
  • 1hr.gif
    1hr.gif
    23.2 KB · Views: 161
i am testing New Trend Indicator .... long on EUR/USD
 

Attachments

  • untitled.GIF
    untitled.GIF
    57.1 KB · Views: 170
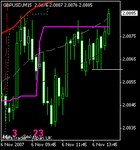
nice clue on gbpusd 15min?? 3 tests of that 0862 area before a hammer candle and up... That 0861 being the high before the higher low at 0841 that followed the retrace off the previous daily highs around 0884.
 

Attachments

  • 15min.gif
    15min.gif
    6.8 KB · Views: 149
Last edited:
Out at 878 +25 pips.
Long 860, tied to catch a falling knife as div on 5min, out at 840. -20 pips.

bbmac, have backtested your idicators on a 5min TF only with no confirmation from other TFs - leads to more optimisation, while backtesting, and falsely good results:cheesy:

I find the faster macde/osma really comes into its own on the 5 and 1 min - esp on the 5. On the longer TF its prety much the same as 12/26/9. I owe you one - its possible to trade just the 5min - I have 30 trades so far. Net profitable, when I have soem more wil work out the expectancy.

Yrs
CT.
 
CT: Good to hear you're doing ok.

As you know, tech anlaysis tends to be more reliable on the higher time frames which is the reason for sticking with the highest probability set-ups on the lower time frames, and of course for seeking confirming set-ups on the next time frame up + from your trigger time frame, ie on your intermediate time frame+.

Back testing can be difficult unless you know where the supp/res was, as i do not take take a set-up unless i can identify previous or reasoins that there might exist supp/res at the area.

Ther probability is dramatically increased when using these set-ups as a confluence of technical reasons to enter the market at known/identifiable supp/res/sbr/rbs.

Remember too that Reversal set-ups (unless confirmed by a Reentry set-up on your next tiome frame+) can be just pullbacks/retraces...not out and out reversals....the extent to which depends on the extreme/divergence readins in oscillators on the subsequent time frames, relative strength of the supp/res causing the opposing move and to some extent the instrument's current relationship to it's ATR.)

Hope it continues to go well
 
Last edited:
Attached are some enbooks by well known authors related to the the subjects of price action, and trend etc.. Some may find them useful.
 

Attachments

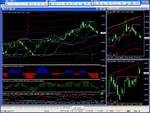
Attached below is my profile 1 showing the main 1min chart and the small 1min and 15min charts, top and bottom right respectively.

On the subject of confluence there wasn't a very clear 1min trigger set-up to enter at that resistance just above 0900 but the 5min intermediate was better (2nd screenshot here) and as you will see there was a confluence of other tech reasons to enter up to the 15min chart re the small chart, the 5min of which is in the post below, ...these included: breech/touch of extreme fib tunnels and donchian channels and breech too of fib channels.

(profile 1 -and- 5min Reversal A[ii) seq)
 

Attachments

  • 5min.gif
    5min.gif
    22.8 KB · Views: 159
  • profile 1.gif
    profile 1.gif
    54 KB · Views: 166
not bad for first try on this trend idicator +13 pis profit
 

Attachments

  • untitled.GIF
    untitled.GIF
    43.7 KB · Views: 171
The 5min small chart confirming set-up is attached here.

With varrious strengths (not the strongest) of regular bearish divergence extending thru the 15 and 30min charts the target for the 1st short has to be the last intermediate (in my case 5min) RBS zone.
 

Attachments

  • 5min small.gif
    5min small.gif
    5.5 KB · Views: 149
The screenshots show the 15 and 30min bearish divergence set-ups referred to above;

(15min Reversal A seq, 30min Rev A)

Price has retraced some 30pips off the highs at time of writing, finding some support in that last 5/15min RBS zone. Will price go on to make new highs?? I for one have no idea, Lol...just trade the set-ups.
 

Attachments

  • 15min.gif
    15min.gif
    22.6 KB · Views: 148
  • 30min.gif
    30min.gif
    30.8 KB · Views: 147
Finally, re that short discussed in the posts above, and I've removed all else off the 1hr chart to make it stand out, an H&S in the 1hr osma.
 

Attachments

  • 1hr h&s.gif
    1hr h&s.gif
    4.7 KB · Views: 131
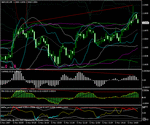
this is 1 day time frame how looks like.....trend is your friend
 

Attachments

  • MyIndicator.GIF
    MyIndicator.GIF
    34.1 KB · Views: 154
Last edited:
GBP JPY rolled the 237.63 longs to short 239.05 was anticipating getting a fill 3925/35 might come yet but happy to get short at this time. The asian session giveth last night, lets see if it taketh a retreat tonight south for these shorts...

39.60 held... : ) thought might of been a pop through it , no cigar.
 
I guess we're looking at it thru slightly different goggles though CB. I'm happy to hold/add the Yen shorts v/s the Europeans for now.

Sure, it's (Geppy) flip flopping off it's s&r levels this week, but the structural reasons for maintaining the short (Yen) views haven't gone away.

The better bang for your buck lies with EUR, especially with ECB about to trot out their well versed "strong vigilance" tone on Thursday. That oughta keep EURJPY bouyed.

Sure, they can be skittish instruments when they're spooked, but on the flip side, they're pretty easy to get aboard again when traders remember to take a reality pill.

As ever, tread carefully & trade well 😉
 
I am long on signal of My new trend indicator trend in all 4 time frames turns up
 

Attachments

  • untitled.GIF
    untitled.GIF
    18.5 KB · Views: 166
took 15 pips profit .... of this one
 

Attachments

  • untitled.GIF
    untitled.GIF
    21.5 KB · Views: 140
I guess we're looking at it thru slightly different goggles though CB.

Clearly! (as the bloke in the bloomberg Ad says) :cheesy:

I slipped my NVG's (night vision Goggles) on hence short but I was beaten by time. Knackered hence shortin 39.05 could see 25./35 evn risk of clipping out highs and a sprint beyon 39.74 might of triggered some buy stops to 240 ? anyhow waffling, but essentially my setup said risk to longs hence me rolling, if I'd of waited another hour I'd of got a better fill but after 5.5 hours I caved in ...... no staying power beyond that. 😛

it was already a beyond a 12 hour day off/on by then....

Eyeing up that tasty NY low in my sleep.... 🙂

At the moment still says hold short, so i will do likely for a few hours yet, but trading up to 39.12/30 looks open, power through that will mean i'll be looking to get long, at best, on a reaction , if its contained under,then i'll just hold shorts until my setup rolls.

either way until my setup rolls I'm a spectator.

Good trading ampro
 
Back
Top