FX Trading June 4 - June 8

The GBPUSD closed last week at 1.9823. Will it close this week at:


  • Total voters
    16
  • Poll closed .
I can tell you why..its because instead of riding trends, our natural instinct is to believe that "it cant go any higher". Im not being sanctimonious here..I have a large short position (well large for me anyway) on the Dow from 13660, and when I reviewed the decison this weekend, I had to admit to myself that I had opened the position on the basis that the price was "high enough"..something no one can really predict.

Morning everyone,

Here we are in June and in a very critical period in the markets imo.

On a technical level, cable has bounced off it's long term weekly SAR line (going back to Mar 06) on my charts. My view is 1.98 is now the new 1.93 support level. We have had consolidation at this level and 1.97 has held and so has 1.98. 1.99 tested. This is just a build up to breaking out of the 2.00 level.

I suspect we will try again and using text book theory retrace and on third attempt breakout and hold it.

On my daily charts we are about to breakout of the Standare Error Channel that has been in existence since middle of April 07. We tried last week and failed. Based on that I really can't see cable falling below 1.9730 which was the decisive support area last week.

On the fundamentals, markets are well and truly twisted. ECB talking about a rate increase. BoE likewise. Fed still contemplating a rate increase but no chance they will do it. China talking about cooling it's economy. For everyone out there if rest of world discusses cooling economies and raising rates whilst fed does nothing - this will ultimately mean dollar has some more falling to do.

Moreover, imo the DOW is at it's highs. This is purely based on charts going back to 2003 and previous past hypes like in 2000. There is no intrinsic value in the DOW or US dollar. If you take away the Yen carry trades which are purely speculative then the problem is even worse.

Mr Greenspan has commented on the Chinese bubble again. I find it curious he does not mention the DOW. At least in China there is real economic growth and productivity gains (I do agree there is a bubble there too). However, for the DOW there is stagnation - no growth and inflationary pressures. But everybody for some reasons justifies all news including bad ones as hey we are in a boom period.

I would be very weary of shorting cable with these strong undercurrents.

Good trading everyone...
 
I remember a few trades a long while back where you would swim against the tide after a strong NFP move but in fairness, the ones you caught were top notch! Its all about the W/L % though...

Yep! I had this "strategy" of using RSI or MACD divergence to gauge when a move post GDP or NFP number, was over and then trade in the opposite direction. Got hurt quite a few times, but when I won..I won BIG!

happy days....
 
Morning everyone,

Here we are in June and in a very critical period in the markets imo.

On a technical level, cable has bounced off it's long term weekly SAR line (going back to Mar 06) on my charts. My view is 1.98 is now the new 1.93 support level. We have had consolidation at this level and 1.97 has held and so has 1.98. 1.99 tested. This is just a build up to breaking out of the 2.00 level.

I suspect we will try again and using text book theory retrace and on third attempt breakout and hold it.

On my daily charts we are about to breakout of the Standare Error Channel that has been in existence since middle of April 07. We tried last week and failed. Based on that I really can't see cable falling below 1.9730 which was the decisive support area last week.

On the fundamentals, markets are well and truly twisted. ECB talking about a rate increase. BoE likewise. Fed still contemplating a rate increase but no chance they will do it. China talking about cooling it's economy. For everyone out there if rest of world discusses cooling economies and raising rates whilst fed does nothing - this will ultimately mean dollar has some more falling to do.

Moreover, imo the DOW is at it's highs. This is purely based on charts going back to 2003 and previous past hypes like in 2000. There is no intrinsic value in the DOW or US dollar. If you take away the Yen carry trades which are purely speculative then the problem is even worse.

Mr Greenspan has commented on the Chinese bubble again. I find it curious he does not mention the DOW. At least in China there is real economic growth and productivity gains (I do agree there is a bubble there too). However, for the DOW there is stagnation - no growth and inflationary pressures. But everybody for some reasons justifies all news including bad ones as hey we are in a boom period.

I would be very weary of shorting cable with these strong undercurrents.

Good trading everyone...

Excellent points. As Ive said before, I think there is much more to come of of the sub prime debacle in the Us and that this will hit the Dow hard.
 
FWIW the Market Matrix guys are calling for a top in the stock indices today at the latest.

http://www.tradertom.com/analysis.htm

Whilst he is primarily trading the Dax he is calling for a top in the US as well.

"sorry for the delay. I am watching the market because I have a significant turn today. The DAX is not playing ball with my thoughts, and I am losing money right now. I am sure it will come good. ...."
(my emphasis added)

from one of Toms links: http://www.themarketmap.com/

"Do you want to know where the major indices and currencies will be turning today?"
"Simply put, our program provides you with a chart with the projected path of the individual instruments available, such as indices and currencies."

am I being cynical, or should Tom use his own MarketMap service? :LOL:

(sorry, I know he is a well-respected trader and all - just having a bit of fun)

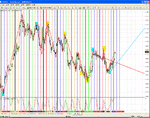
EDIT: I am just frustrated at seeing patterns if I squint hard enough. Sometimes I see the "blue day" as being the harbinger of reversals, but I think I can see a 2-day moves. problem is, I cant work out when/where the inversion takes place. actually I can, but only by a tortuous hindsight analysis. (note: I am not using the official colurs, but that doesnt change the logic.)
 

Attachments

  • delta-001.gif
    delta-001.gif
    125.2 KB · Views: 172
Last edited:
Hi Everyone,

Well the start of another week and I'm looking to go short tonight.

Just got an entry now for a Sell at 1.9820.

I'll update this in the morning.

Well I got stopped out today - again for a 48 pip loss. :cry: :( :eek:

I'm starting to question my system now - which isn't good - but my backtesting was only based on 6 months of information and I'm worried that the six months might have been a fluke for the system. It could be that from November to May were good results when overall it isn't quite as good. Or it could be that this is a system that doesn't work well over the quieter summer months.

Anyway since I will be going on holiday myself next week - I'm going to sit out from trading this week and do some more evaluating of the system.

On a different note my Eur/Jpy trade did well and bagged 18 pips. So maybe all is not lost after all.
 
great stuff. How is your Nymex trading going?

Thanks Zuke, definitely preferring Nymex to forex atm, the follow throughs are fantastic off s/r levels, downside being the large stops required to capture trend on the bigger tf's.
My last short was finally stopped out at 63.50 last Wednesday from original 65.20 entry, I left a $ on the table with low being 62.40 on the same day post inventory data.

Hows your crude trade fairing? Good luck with the dow and dax btw, I have been burnt twice shorting those 2 last year, got fed up and now I just take pullbacks to ma's (365,100 and 28) off 60,240 and dailies.
 
Bit miffed I had to go out this morning, still long on my set up. Just sidelined watching.

If it comes back to 1.9870/75 i'd go long at this time. Dunno if it will :) might be good for my t2w comp entry in the next week or 2 im still long $2 bucks. :p

With the comp, i found it hard to concentrate firing orders on there, on my platform, and posting on here :) over 4 currencies , crazy. I might have a punt on the comp on long term set and forget or something, but im terrible multiday positions, so I think i'd get slaughtered.
 
Last edited:
Well I got stopped out today - again for a 48 pip loss. :cry: :( :eek:

I'm starting to question my system now - which isn't good - but my backtesting was only based on 6 months of information and I'm worried that the six months might have been a fluke for the system. It could be that from November to May were good results when overall it isn't quite as good. Or it could be that this is a system that doesn't work well over the quieter summer months.

Anyway since I will be going on holiday myself next week - I'm going to sit out from trading this week and do some more evaluating of the system.

On a different note my Eur/Jpy trade did well and bagged 18 pips. So maybe all is not lost after all.


Hi Jilly,
I did some testing on the basic idea of follow through the next day: if there's been an up day on cable then go long on the close and exit the next day's close and v.v. for a down day. It's not the same as your method but IIRC your method came from a similar idea. I tested it out and it has worked reasonably well for the last year, however when I tested it back further it didn't work at all. I've often found methods that work well for a short period of time but fall apart over long periods. Personally I think that 6 months is too short a time to back-test anything other than the highest frequency trading methods: you never know whether you've just hit a temporary abberration or something more solid.

HTH

I think the method that you're talking about is the Daily Scalping method that tkimble has put up on FF. He states that if today is a bull day, then buy at midnight. If today was a bear day, then sell at midnight. You trade the same direction for a maximum of three consecutive days and after that you change direction.

You're right in that it's worked quite well, but it's always felt quite arbitary to me - just trading in the same direction tomorrow as today, doesn't seem to have any real bearing to it.

I started with this system but then started drawing out what happened with the price during the day and then what followed on between 10pm that night and 8.00am in the morning. This is how I noticed the correlation between which formed second/last, the high or the low, and also when it was formed. If it was formed after 8pm at night then it tended to reverse the trade.

I'm not able to access CMC at the moment so I can't check back to see if I made a mistake in my evaluation. But as soon as I get home tonight, I'm going to check it.

You are very right though - 6 months is too short a timescale to back test a system. So my question is; is there a charting package that I can subscribe to for a month to allow me access to intraday data that goes back further than 6 months. I'm thinking of a 10 minute chart that perhaps went back 1 year (2 would be even better). Anyone know of a company that does this?
 
+ 19, covered long at 1.9823.5, edit, exit 1.9923.5 not 8 never was gonna hold too long this time of day, and my hard drive is struggling to keep up. Making that nice grinding noise. not good. needs a sort out.

Done for the day, here.
 
a gnone

yes easy system that especially if like me you don't watch screens all day. i just check it in the evening and readjust. so today would have been a long cable [if i did cable]. Not all systems work on all currencies all the time it seems and cable is perhaps a hard one to work a system out for because it trends and ranges and generally chops about which are competing strategies. So to make the most of it one needs to choose a more steady currency but cable, with some modifications is do-able.
 
I think the method that you're talking about is the Daily Scalping method that tkimble has put up on FF. He states that if today is a bull day, then buy at midnight. If today was a bear day, then sell at midnight. You trade the same direction for a maximum of three consecutive days and after that you change direction.

You're right in that it's worked quite well, but it's always felt quite arbitary to me - just trading in the same direction tomorrow as today, doesn't seem to have any real bearing to it.

I started with this system but then started drawing out what happened with the price during the day and then what followed on between 10pm that night and 8.00am in the morning. This is how I noticed the correlation between which formed second/last, the high or the low, and also when it was formed. If it was formed after 8pm at night then it tended to reverse the trade.

I'm not able to access CMC at the moment so I can't check back to see if I made a mistake in my evaluation. But as soon as I get home tonight, I'm going to check it.

You are very right though - 6 months is too short a timescale to back test a system. So my question is; is there a charting package that I can subscribe to for a month to allow me access to intraday data that goes back further than 6 months. I'm thinking of a 10 minute chart that perhaps went back 1 year (2 would be even better). Anyone know of a company that does this?

TradeStation will give you access to intraday Gain Capital data going back more than 3 years which you can export as ASCII data. What's more you can actually program up the strategy within Easy Language and test it out.
 
TradeStation will give you access to intraday Gain Capital data going back more than 3 years which you can export as ASCII data. What's more you can actually program up the strategy within Easy Language and test it out.

Do you need to trade with them? Or can you just pay a monthly fee to access the data?

All I really want is data and a company where I can just pay for access on a monthly basis - you can do this with ProRealTime, but again I don't think their intraday data goes back any further than the data I have with CMC.
 
Got the 849 for the second profit target so I am now down to my core position. I will be looking to re-enter long if I get the right sort of set-up.

Well there's been no opportunity to re-enter long so far for me. With more than 100 pips in profit I am trailing a stop on half my core position - I know it's not logical but I don't want to leave so much on the table. I'll still have a core position it's just that it will be smaller than before!
 
Do you need to trade with them? Or can you just pay a monthly fee to access the data?

All I really want is data and a company where I can just pay for access on a monthly basis - you can do this with ProRealTime, but again I don't think their intraday data goes back any further than the data I have with CMC.

You don't have to trade with them: I use them and I don't trade with them.
 
You don't have to trade with them: I use them and I don't trade with them.

I can't seem to find where this is. All the details I've seen on their website want funds deposited with them first.
 
Top