Great Sunday morning to you all...
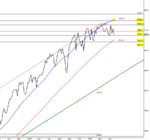
SPX charts drilling down from Weekly to Daily's.
Pls note, PPs are different for the W & D charts.
Weekly chart shows long term pic. Clearly OB and and key points being it has breached the 100 DEMA and moving to test the 200 red line.
We are also below Weekly PP 2095...
Can't see what can take this market higher and maintain short bias until HHs come into play.
I have first Fib retrace at 1795 and expect it to be tested sooner or later. Effectively this is 1800 just for starters.
I'm also expecting the two GANN green lines to be tested down the road. So 1500 is not a far stretch of the imagination either.
The DAILY chart is the key PPs in play.
2113 is now history.
PP @ 2087 agrees with your your Horiz R / Prev S
RSI showing down so expect first part of the week to continue testing lows.
May rise to middle or latter part of the week.
fwiw expecting test of
2050/40s. Any breach of 200 MA may signal sharp drops.
Word is likelyhood of a rate rise in Sept have risen. Markets may take a plunge just to send a signal to Fed not to think of anything so unreasonable as raising them.