FTSE, DAX, DOW Trading Ideas and discussions

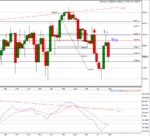
DOW - End of Week - Daily Charts -

Here is the CS view guys...

- Three crows
- Weekly retrace to 61 then 50
- Negative divergence in MACD
- On close price - bulls were unable to recover 50% or more of the ground against bears. Not looking good for the bulls.


Looking bearish. PP S/R levels are;

R3 - 18220
R2 - 18165
R1 - 18100
PP - 18045
S1 - 17980 (17985 Resistance)
S2 - 17925
S3 - 17855 (17820 breakout point)
 

Attachments

  • DOW_D_150615.GIF
    DOW_D_150615.GIF
    32 KB · Views: 85
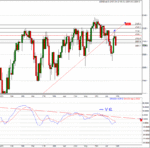
SPX - End of Week - Daily Charts -

Here is the SPX view... Pretty much same as the dow. Key note is the long term trend support line from October retrace has become resistance at point marked by blue X. Coupled with point below is not a good sign for the bulls.

We are getting a bounce from 2092 and may test for breaching PPoint @ 2109 if the bulls show in the early part of the week. If not then down elevator imo.


- Three crows
- Weekly retrace to 61 then 50
- Negative divergence in MACD
- On close price - bulls were unable to recover 50% or more of the ground against bears. Not looking good for the bulls.


Looking bearish. PP S/R levels are;

R3 - 2125
R2 - 2120
R1 - 2115 (Res area)
PP - 2109
S1 - 2100
S2 - 2097
S3 - 2092

D - 2085 (Sup Area)
D - 2074 (Sup Area)
 

Attachments

  • SPX5_D_150615.GIF
    SPX5_D_150615.GIF
    31.9 KB · Views: 85
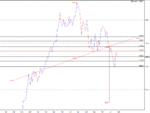
To tally up with your view Dentist, here is the DAX from CS perspective.

Perhaps for obvious reasons it shows same view as dow and spx.


Looking bearish. PP S/R levels are;

R3 - 11640
R2 - 11545
R1 - 11425
PP - 11330
S1 - 11210
S2 - 11115
S3 - 10990

MACD looks over sold but unless the long term trend line is breached it's likely to tank further imo.

There also is a significant H&S pattern if 11500s get rejected and DAX turns back down.

If 11000 fails then based on H&S reversal pattern, 10200s likely to be probed.
 

Attachments

  • DAX_D_150615.GIF
    DAX_D_150615.GIF
    44.5 KB · Views: 84
  • DAX_D_150615_HS.GIF
    DAX_D_150615_HS.GIF
    20 KB · Views: 96
chart is SPX
i have tried to eliminate alot of noise with these inputs
shows the price action since 6th April
basically...its in a big consolidation with 2075 area/aqua horizontal as main support
been tested a few times..Greek crisis and still held.the last time was on Thursday..calling these reaction points.These have had fakes on a test ie unsupported breakouts..have not shown these...i think that gives you the three crows appearance.The latest move down from 25th may gives the appearance of a new downtrend...but as you can see its not a done deal as yet
we need to see 2075 area taken out and that becomes resistance..imho
indecision...great for us...lots of volatility

jh5uon.gif
 
some idea for the trading range on the dax for next week
seems to be a solid support area that was hit last Thursday..higher green trendline.a reasonable cluster of trendlines there and a prev breakout area
2 down moves shown
11049 area is a trend test
11419 horizontal res
11294 is minor trend res
11608..if we really get lucky

kanxc3.gif

all areas will be tested..imho..market undecided on direction...from this chart..this is a recoil in an uptrend
 
into the open...scalpers paradise ..because nobody knows the real direction/bias
11232 is prev supp

11246 is a breakout point
trend res starts at 11294 area going up to 11356
..then 11419 /horizontal
11150-11170 area
11050 trend supp
down to 10989 area
trend into the open is up/5 min
possible first move at the open is to test the 11294 area..if that happens..then it needs to hold 11250 and

especially 11215 as supp
also on the list 11121 and 11277
 
Last edited:
Thanks Atilla and Dentist.

Levels I'm seeing for this week (could be resistance or support - going by S / R theory) I trade off these area whether long or short, doesn't matter i.e take one example. Now the current price is 11208, I'd take a long expecting it to get to 11234 area, then I'd probably take a short, expecting it to move back down if that makes sense. If we break that 11234, then I follow it by taken a long then a short at the next res area. Always seek confirmation though! Anyway, onto areas:

11726
11632
11598
11515
11450
11420
11399
11360
11288
11234
11190
11139
11039
10997
10872
10780 - Trend support and Horizontal Support. This is a key area IMO if we get there.

Other areas we have marked:

10650
10720
10559

Areas can and will probably change depending on what the charts are doing on a min to min basis.
 
Last edited:
Just preparing for the week ahead chaps and here is a three chart view.

If H&S reversal does take place - then we may get approx 15% correction in the DAX.

How it will translate to SPX & DOW tricky to tell but since last October dax has out performed the US markets. This was the result of US curtailing QE and EU embracing hers imo. Clearly visible in the charts.

With Grexit (Greece Talks Crumble After 45 Minutes Setting Up Decisive Week) in the offing, DAX is about to unravel.

18th Thursday - key meeting.
 

Attachments

  • DAX_D_150615_HS_crl.GIF
    DAX_D_150615_HS_crl.GIF
    111.2 KB · Views: 56
On the wires
eu losing patience with Greece
Draghi speaking on Monday
could be volatile
Speaking at 2pm
All those levels could be useless
 
minor areas that might give us a clue to how the market is reading the latest news on Greece
looking for the reaction in theses areas...overnight
the minor trend is down
looking for trend continuation or recoil failure or even some basing and a new uptrend

looks like we will have some fun

2r7ptut.gif
 
eur crosses have gapped down
eurusd needs to hold 1.1200 area..eurjpy 137.80 area
spx gapped down to our 2083 area/prev breakout
 
eur crosses have gapped down
eurusd needs to hold 1.1200 area..eurjpy 137.80 area
spx gapped down to our 2083 area/prev breakout


Short on Euro.
I agree with 1.12 and have 1.1175 as S1. If news is bad then 1.10 to be tested.
Have 1.1235 as PP.

I have SPX @ 2086 at the mo and can see a test of 2070 before possible bounce. There is something strange here though as despite US having no impact from a Grexit is awfully tetchy about the decision.

It's going to be an eventful week :whistling
 
Oil has given up the 60s nicely and back down probing 59s. :)
In fact it's been oscillating between 58-62 really well for few weeks now (y)
I should add my expectations of $56 has yet to materialise. Perhaps I'm being greedy.

Gold showing a small bounce. Expect it to test 1190s before Fed takes it back down to 60/70s again I reckon. Strange to see gold and oil moving in opposites but we live in a new era. :)

@Atilla, Greedy? Never!
 
Looks like spx held at 2080. You were right again Mr D. (y)
I'm thinking it will try for 2100 if it can jump over 2090.
Even if Fed doesn't raise rates it's all dressed up with no where particular to go. I'll give it a max blow=up at 2140 and no more. (n)

DAX is trying for 11100 having turned off 11200 level. At PP-S1 11060 at the mo.

Euro at PP 12370. Trying but still much Grexit pressure weighing on its shoulders.

Oil continuing slow descent 59.60 and

Gold couldn't take out PP-R1 @ 1185. Losing it's shine no doubt Fed has it rattled. It's also making LHs so one to watch carefully. No more longs for now.

Asian markets looking off colour too. Oooohhhhh :-0


I think it's going to be a fast and furious week. (y)
 
Premarket move / tank from 11139 area as we said overnight. Few levels broke below that broke down however, but not the bounce from 10997 area as we said
 
Top