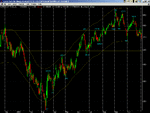
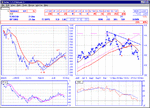
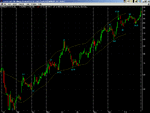
Here's a blown up diagram of trendline support...although not it might not be a valid trendline...it's just taken across the last two lows in 10 min lin chart.
Notice how the 10 min after the close below the trend line coses back above the trendline...Would have kept you from going short
Notice how the 10 min after the close below the trend line coses back above the trendline...Would have kept you from going short


