You are using an out of date browser. It may not display this or other websites correctly.
You should upgrade or use an alternative browser.
You should upgrade or use an alternative browser.
- Status
- Not open for further replies.
Bonsai.
Sorry about the rushed post this morning I was in a hurry.
I shall now be here for the rest of the day,but away all day to morrow.
I will explain my statement AM.I had projected a target of 4415,and the fib retracement 618 was to 4350.On my return,I was surprised at the rapid fall to 4360.Hope your nanny goat came home. Best of luck.
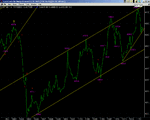
Well, the questioned i raised this morning about the validity of the top trendline was answered. It did prove resistance. Also
notice the new trendline that appears to we defining the lows of the last three days. Well at least we appear to know the limits of the current move (upper and lower trendlines).
notice the new trendline that appears to we defining the lows of the last three days. Well at least we appear to know the limits of the current move (upper and lower trendlines).
Attachments
here is a pile of statistics for you to chew over and spit out.
I have congestion/value since 4219 centred on
4365
4330
4265
If the whole move is over (and it may not be) then I have
fibs at
4333
4310
4287
The bottom trend line from 4219 is currently at 4331
hmm, the 4330 area seems to repeat !
(may just be co-incidence)
The whole move from low to high took 127 hours (16 days?)
so fib corrections look like
48/63/78 hours.
6//8/10 days.
Todays candle could be the start of dark cloud cover.
On balance, and despite the goat today, I have some suspicion that the whole move is not yet over.
Last edited:
- Status
- Not open for further replies.
Similar threads
- Replies
- 478
- Views
- 70K
- Replies
- 2
- Views
- 3K

