FTSE 100 Intraday - December

To: Jonnyy

We would like to thank you for the expression of interest and concern that you have in our health.

We are pleased to advise you that all went very well and we were particularly charmed by the nice young man who removed that nasty cartilage from our knee.

We have also had a quick clean up of the royal face so that
we will look more photogenic for our Christmas address to the nation.


Signed in the absence of Her Majesty

by : Brenda
 
ftse's even further away from the dow now - no wonder
indexking took an early bath!
 
yup

it does seem a reasonable proposition that the smart money in the U.K says the Dow is going to fail and they have already taken their positions ?

For all I know, the smart money in the U.K may have a dollar or yen base !

Unfortunately, reasonable propositions are not what the market is about. The big guys can be wrong, just like you and I.

well like me, anyhow.
 
barjon

by the look of it, its not Index king that's taking the bath.


:LOL:
 
Last edited:
don't leave me out of being wrong!!!

the chronically low volume of the last three weeks certainly
points to a lot of people sitting on the sidelines watching
and waiting.
 
bonsai

I know you pyramid a bit but do you do the same on the way out?
Seem to recall some advice you got from your broker many moons
ago that persuaded you to off the lot (that was shares I think).
 
you mean sell half , wait and the sell the other half ?

yes, that was shares. Never do that anymore. If in doubt, sell the lot.

day trading ? not always.
I often get out too early.
So every now and then I close half and wait.

Invariably, that is when it moves against me and I get less for the second half than the first.

Doh

never have found a way round it.
 
mmm, my experience too during the day.

often stagger exits on my swingers tho', particularly if I've taken
a good meal off the table.
 
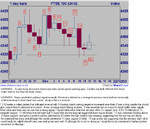
Thought I'd summarise the last three weeks of candlesticks this week-end. Mostly the comments reflect those made as we went along so I don't think too much hindsight has crept in :)

I really don't have any idea whether anyone has the slightest interest in these candlestick posts. If so I'm happy to continue but, if not, I'll stop wasting my time and littering up the thread.

A clue would be nice :)
 

Attachments

  • candles.gif
    candles.gif
    17.6 KB · Views: 228
mildly bullish for early next week ?

The Index may now have found support by bouncing off the down
trend line?

With expiry only a week away, it would not be surprising for the sitting bulls to make a last stand ?
:LOL:

Barjon
candles allow for gaps but just seem to spell out weakness ?
 

Attachments

  • dec12.gif
    dec12.gif
    25.1 KB · Views: 232
bonsai

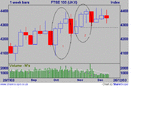
I'm still mildly bullish on the weekly chart since the 2 reversal
patterns (1 - advance block and 2 - stalled) caused only relatively
minor reactions. The final high wave candle is a "Gawd only
knows" uncertainty one with maybe a slight bearish bias given
preceding candles.

A bit like your final candle although I'd say that has a bullish bias.
Incidently your second last candle is only mildly bullish which
explains the rather weaker move than I was expecting from my 15

Just goes to show there's always some chart variation you can
call on to prove you right :cheesy:

As usual we'll wait and see (I'm still waiting to see what happens
when a decent bit of volume kicks in :confused: )
 

Attachments

  • ftse.gif
    ftse.gif
    12 KB · Views: 408
Last edited:
might get some decnt volume tomorrow after that news...if we dont then I dont know what will get it going?
 
FTSE Patterns + Candlesticks

Only joined this billboard a couple of days ago, but already have found it more informative than any. Especially wrt to chart patterns.

Barjon, keep the candlestick interpretations going. Its always good to find other/confirming interpretations.

I was slightly bullish for next week, and with the news of the capture of Saddam Hussein, i think the bulls will come out the closet for a last stance.

I do think the next major move is down and my main reasoning for this is the bearish formation of a rising wedge..... i don't know how to add my own charts (guidance welcome) so i have detailed below.

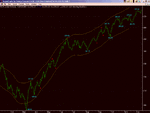
Using simple end of day close line shows a rising wedge if -

U draw a trend line through the following peaks together (15/10, 14/11, 1/12)
and
U draw a trend line through the following troughs (24/10, 20/11, 8/12)

A rising wedge, as u will know, is formed by higher highs and higher lows.....confirmed by the above. Normally a continuation of a down trend, or reversal of an up-trend. Volume normally expands at the start of the triangle or wedge, contracts as the pattern develops and then expands on the breakout. Rising wedges exhibit higher volume on the down-swings.

Check the volume charts for the period and u'll notice the above to be true, i.e. higher volumes on the downswing with volumes significantly lower than the 20 day average since the 24/11, i.e. the pattern is coming close to end.

There has also been major divergence against major market indicators (advance/decline ratio, new highs/new lows ratio and breadth thrust), which further suggests a break downwards.


U will also notice from the candlestick chart that the 3rd and 4th of December opened/closed at the same price (4,379 - 4,392). This tweezer tops/bottoms (matching tops/ bottoms) is a minor reversal signal, which is important when the candlesticks form another pattern.

This, i think, is referring to a reversal of the new pattern of waves that has formed since the 1st of December, i.e. we have broken the 5 up 3 down Elliot Wave formation, and have moved into a zig-zag 5 down and 3 up formation (with Friday being the beginning of zig zag wave B, with target of 4,380).

The tweezer top/bottom pattern has also acted as a divergence point away from the US DOW/S&P, with correlation moving from 0.6 to 0.4, i.e. strong positive to weak positive. Perhaps explaining why we're not sitting above 4,400.

Rising wedge target :

Peak - trough = 4,410 - 4,239 = 171
Target Move = 171 from breakout point.
I have taken the breakout point to be 4,360.
Target price = breakout point - target move = 4,360 - 171 = 4,189.

Interesting to note that 4,183-4,189 is a Fib retracement from 1st Jul trough.


Suppose we'll have to wait for the breakout to see wot happens.

All thoughts welcome
 

Attachments

  • rising wedge & market indicators.doc
    33.5 KB · Views: 190
Finirama
not all your chart seems to have come through ?

have sent you a PM on how to post your charts.
 
Hi Finirama and welcome,

There are 2 threads about posting charts:

Posting Charts on This Board by Bonsai in Techies Corner
Posting a Chart by FTSE Beater in FAQs

I think you have to make sure you convert to gif (unless they are
already in that format) to avoid clogging up the works, although
bonsai will have something to say if that's not right!

Hadn't thought too much about the matching opens/close you
refer to. Did consider that the tweezer bottom (5/12 and 8/12)
might be important since it was around the base support of the
earlier long candle - but it was not to be.

Good trading

jon
 
thoughts about monday opening

this is an exogenous event !
especially with expiry so close !

if you are long already - merry cristmas :LOL:

if you are short - :cry:

depending on globex et al, expect a totally different looking order book to be on display first thing.

there should also be a lot of pre market orders floating around
but they may have to fill the outstanding limit buys first.

it may be just what was needed for A/D to regain its trend line ?

a new high equates to about 160pts on the Dow.

This is the sort of thing that can create spike tops.
caveat emptor ?
 
Irrespective of the helpful news today, the World Index still exhibits higher highs and higher lows. Therefore, the bull market remains intact despite concerns about significant overhead resistence for US markets. However, I will watching very closely how markets react to the news (especially if they cannnot hold any gains) as I am very aware of Bonsai's comment that these kind of events are typical of causing blow-offs.
 

Attachments

  • world.gif
    world.gif
    34.1 KB · Views: 393
No joy with the charts :(

Bonsai, i tried as suggested, but having problems with size.

I'll read up the techie corner and keep trying.
 
Hmmm ... Saddam. Just the news I need - not.

An interesting week ahead whichever way you look at it though. Market behaviour over the WHOLE week will tell us an awful lot about the future.
 
Top