You are using an out of date browser. It may not display this or other websites correctly.
You should upgrade or use an alternative browser.
You should upgrade or use an alternative browser.
got sucked into one but knew it was risky. Dow finally closed a gap so might get some movement over there today tomorrow.
FBB ADVFn is shocking. TT has some nice people on it but just seem to post entry/exit. Only this thread on T2W interests me. So I am still a PBB ADVFN user at heart.
FBB ADVFn is shocking. TT has some nice people on it but just seem to post entry/exit. Only this thread on T2W interests me. So I am still a PBB ADVFN user at heart.
barjon
Legendary member
- Messages
- 10,752
- Likes
- 1,863
just back and tuned in expecting to read about champagne
corks popping - maybe tomorrow.
A question for you EW afficionados. I can understand (just) how
EW relates to the normal ebb and flow of supply and demand, but
how does it cope with moves caused by market "shocks" like the
2 this week (vod and rbs). Don't such shocks throw it into some
disarray?
corks popping - maybe tomorrow.
A question for you EW afficionados. I can understand (just) how
EW relates to the normal ebb and flow of supply and demand, but
how does it cope with moves caused by market "shocks" like the
2 this week (vod and rbs). Don't such shocks throw it into some
disarray?
it is quite uncommon for news to change the existing trend.
it sometimes seems to exaggerate it by causing an extension of the wave count.
maybe this is because of insider information, maybe not.
but as the elliott process is one of fitting the count to the market, it is also guilty of 'curve fitting'.
nevertheless both vod and rbs were already in uptrends.
it sometimes seems to exaggerate it by causing an extension of the wave count.
maybe this is because of insider information, maybe not.
but as the elliott process is one of fitting the count to the market, it is also guilty of 'curve fitting'.
nevertheless both vod and rbs were already in uptrends.
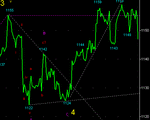
My comment refers to the next few days. Of course the SP500 has to take out 1143 to confirm the failure to make a new high, but yesterday's failure to make a new high is potentially worrying.
Anyway I will show the SP500 chart to highlight the "triple top " formation for everyone's info.
Anyway I will show the SP500 chart to highlight the "triple top " formation for everyone's info.


