Extreme Futures Daytrading

.

  • .

    Votes: 1 100.0%
  • ..

    Votes: 0 0.0%

  • Total voters
    1
Day 20 (Week 4)
Month's plan beginning balance: £50
daily target is 5% (£2.50)
base stake: £0.1/tick
max stake £0.8/tick

Account start balance: £50.00 (on 21 July 2014)
Current balance: £106.50

Account profit(net return):
plan: 100%
actual: 113%

Win/Lose days: 19/1
Win/Lose trades: 105/96

********************************************

Horrible day. First losing day After all that speech about having control etc. I almost finished with target in the first hour. Then I entered into a trade with YM. Too high risk, bad decision, meltdown.
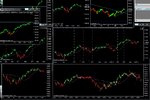
Because of previous days performance still up compared to plan, so I consider first month finished. My mother is here so it is not the same to trade, I shouldn't even have started trading. Very slow market, I was in the long at a perfect place but exited early, and missed the continuation. Made a screenshot of the chart, will try to mark the trades tomorrow but too tired now been looking at charts all day moving horizontally.
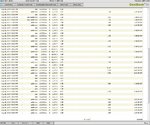
Good part is I only lost £3.60 altogether, but lost £11 on the YM which means I am way up on Russell. Just have to stick with it.
 

Attachments

  • 20140818.jpg
    20140818.jpg
    357.6 KB · Views: 150
  • 20140818c1.jpg
    20140818c1.jpg
    316.4 KB · Views: 162
  • 20140818profit.jpg
    20140818profit.jpg
    183.5 KB · Views: 146
Last edited:
Like I said I am not proud of yesterday. Trading YM, too big size, end of the day I started averaging down...lost it completely. Not used to trade all day nowadays.
Wish that was the only reason.
So here is yesterdays chart, trades and exits marked, as well as I could.
(No exits marked for last few trade)
 

Attachments

  • 20140818c1.jpg
    20140818c1.jpg
    312.4 KB · Views: 154
Last edited:
Yesterday, it might have affected me... I went on grail-hunting. Been looking at my Metatrader, and magic-wonder-perfect-infallible heap of indicators. Reason????? maybe I was bored or something.
Its not like I am looking for something new or better, I know that's not the key. I left MT4 open, because some of those indicators looked too good and I wanted to test them live, and of course, they were repainting ones, so ended up removing most of them, but still wanted to test the remaining..unfortunately it affected me, and have been entering trades based on that.
Stupid. For example my first 2 YM trades were based on that.
 
Day 21 (Week 5)
Month's plan beginning balance: £100
daily target is 5% (£5.00) (with the original plan)
base stake: £0.2/tick
max stake £0.8/tick

Account start balance: £50.00 (on 21 July 2014)
Current balance: £108.20

Account profit(net return):
original plan: 110%
boosted plan: 120%
actual: 116.40%

Win/Lose days: 20/1
Win/Lose trades: 106/96

********************************************

So I don't know how to do this. I am trying something else, swingish trades. I stayed in my Russell short all day, but no significant gain exited after close.
S&P: I entered with lower risk, not necessarily based on any kind of setup, but getting close to a monster resistance, so expecting a pullback.
This is all new to me.
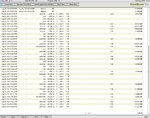
I decided that floating P&L will not be calculated into the Profit chart..never were, the difference is I never had open trades before.
But I have to start this. The SB company will pull me apart after a while if I keep on scalping with larger size. I have to change a few things, or, at least got to try.

So trade and exit marked. That is all for today. Market flatlined. :D
 

Attachments

  • 20140819.jpg
    20140819.jpg
    82.5 KB · Views: 151
  • 20140819c1.jpg
    20140819c1.jpg
    329 KB · Views: 155
  • 20140819profit.jpg
    20140819profit.jpg
    183.6 KB · Views: 150
Last edited:
Day 22 (Week 5)
Month's plan beginning balance: £100
daily target is 5% (£5.00) (with the original plan)
base stake: £0.2/tick
max stake £0.8/tick

Account start balance: £50.00 (on 21 July 2014)
Current balance: £109.20

Account profit(net return):
original plan: 120%
boosted plan: 140%
actual: 118.40%

Win/Lose days: 21/1
Win/Lose trades: 115/110

********************************************

So. Another disappointing day. First trade I was sitting in for 2 hours while watching the price do nothing. I thought market flatlined yesterday. I was wrong.
Couple of unsuccessful ES trades, of course nothing smart just haphazard greedy impulse driven top-picking, lost 6.80 on those, deserve it too.
Day is positive so I book it as winner, but its more like breakeven day, target not met, still on track with the plan thanks to the successful day.
Will not trade tomorrow . Won't have time and need to clear my head cause I lost my edge, the edge I never had, but at least I thought I have it :D
Now I don't. Need to calm down and break that £110 resistance on my profit chart :p
That's all for today.
 

Attachments

  • 20140820profit.jpg
    20140820profit.jpg
    185.3 KB · Views: 149
  • 20140820c1.jpg
    20140820c1.jpg
    309.9 KB · Views: 157
  • 20140820.jpg
    20140820.jpg
    361.9 KB · Views: 142
Last edited:
Did not trade today, as promised.
Instead went to see the Deep in Hull, and Cleethorpes (UK)
It was very nice, baby loved the fishys. :D
I was thinking about yesterday, and I had a thought:
It is better not to make money than to lose some.
Sounds like something that someone must have said before me.
It is an obvious fact, but some minds doesn't always end up at this conclusion.
I was also thinking what could have changed since the beginning.
Some impatience growing, since the money I made and will be making in the next couple of months is far from enough to live off, not to mention to increase equity levels after living off of it.
Also, when I started I said the most I can lose is £50 no worries. But the money I made/earned/suffered minor nervous breakdowns for last month all that huge amount of cash, another £50..when it is there, I feel that it is mine too, so losing it does not exactly feel like losing money in Monopoly. :)
Have to work on that, change the circuits in my unregulated mind.

Just saw today's charts, ppl and robots FED and Putin shoulder to shoulder making their last effort to reach the inconceivable peak of S&P :)
At the same time, Russell said, noplease, and had a very nice daytradeable day. Would have made a killing. Of course It always seem so easy looking back at a chart.
Good thing I came to my senses and quit my not so very successful top-picked S&P trades.
 
Last edited:
Day 23 (Week 5)
Month's plan beginning balance: £100
daily target is 5% (£5.00) (with the original plan)
base stake: £0.2/tick
max stake £0.8/tick

Account start balance: £50.00 (on 21 July 2014)
Current balance: £117.80

Account profit(net return):
original plan: 130%
boosted plan: 160%
actual: 135.60%

Win/Lose days: 22/1
Win/Lose trades: 126/119

********************************************

So, no blood so far.
Today I feel I did better. Had 2 YM positions thats not good, again, too high risk
S&P trade was successful exited that and one of the Russel trades on a quick higher low, failed short continuation.
Russell: First trade was great, added trades for continuation it failed. next short failed too.
Was very hard but stopped myself not to trade the news, just one failed short after that and long breakout catched.
After that only one long, looked good for cont, S&P also bounced from previous high, but, failed.
Appearantly NATO threatened or warned Russia, and that's why?
Well, that is what they say :)
I am watching fundamentals much more than before. I don't know yet if I am profiting from that or not.
But this "Yellen" news is exactly why I think it is utter BS. Who in the world would believe that anyone would say right now something like: Oh, yeah well, its all going to the sewers. Everybody knew, that she were gonna say: Oh yeah blahblahblah mumbojumbo. Expectations met. :D


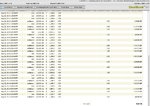
Also modified profit plan, with the agressive plan, not increasing stake in the middle of the month. Greed made me create that.
Also the length of the steps are only depend on how many trades I made a day, I can not predict how many I will in the future on a given day, so I just make approx 10 rows in excel, that makes the current length

And, dunno if its obvious but WHITE lines on chart are exits
 

Attachments

  • 20140822.jpg
    20140822.jpg
    312.5 KB · Views: 121
  • 20140822c1.jpg
    20140822c1.jpg
    341.1 KB · Views: 132
  • 20140822profit.jpg
    20140822profit.jpg
    163.4 KB · Views: 153
Last edited:
and the plan, in numbers, so far looks like this
 

Attachments

  • !plan.jpg
    !plan.jpg
    449.6 KB · Views: 169
Just realized that the picture in post 78 shows the perfect daytrade entry for the last 2 weeks long trend. Of course I did not know that then, Just looked really good. :) And it was.
http://www.trade2win.com/boards/tra...xtreme-futures-daytrading-12.html#post2373400
Funny. I had another good call in post 24, at night 11PM 24th of March.
Called it a Wolfe wave and expected a bigger short... it was going down after that for 2 months.
I have good ideas sometimes. Just don't have a clue about anything :D
http://www.trade2win.com/boards/trading-journals/184110-extreme-futures-daytrading.html#post2303448
 
Last edited:
You are so right! Most of these "market commentary" notions are founded on little more than wishful thinking. We don't need someone's instantaneous rationale for a market move in one direction or another - or none at all. We need a trigger that tells us not "whether" but "when." With such signals, direction is self-evident.

I have two statistics based filters than throw out low-probability trades before I even start looking at them. The filters alone raise the Mathematical Expectation (ME) well above 50%. I next measure risk vs. reward for the surviving potential trades, again using statistically valid Analysis Of Variance (ANOVA). With few exceptions traditional indicators like the MACD and fixed-lookback moving averages are worthless. After identifying an acceptable risk-reward ration - again using valid statistical methods - I use a money management strategy to lock in profits with a break-even stop. At minimum the trade will make decent money. At maximum it may move beyond the target and catch a major move.

Does anyone else use this type of strategy?

Hi, valleyvintner,

I agree with you on the amount and length of forex analyses and market commentaries. I am guessing that many T2W members find it useful - or at least "comforting" to think/believe they have "agreement/consensus" with others. :confused:

However - KEY QUESTION - how many T2W forex traders are making profits daily and/or weekly and monthly basis? I know of a few - but for the great majority, I am uncertain as to what "market news/commentary" can bring to exploit trading EDGES (accept for longer-term macro trading perhaps). :whistling

But as we all know - profitable trading is about trading positive EDGES repeatedly and managing the bankroll/bet sizing, and also managing the "mental capital". (y)

There is one point of difference of experience and perspective however. :cool:

The use of the MACD across multiple time frames analyses have clearly demonstrated positive EDGE basis. When I was working at the Family Office trading desk, there were highly profitable traders using MACD effectively across at least 3-4 time frames to generate very high % win rates > 80%. Moreover, once in the "tide" of the higher time frame MACD trend/momentum biases and moves, the size of Avg $ Winning Trades were MUCH LARGER than the size of the Avg $ Losses. (y)

Of course - the use of multiple time frames in fact can turn many technical indicators into a profitable EDGE tool. I strongly recommend that ALL newbie traders - PLUS individual traders who have NOT YET demonstrated consistent profitability - begin to FOCUS and study/research the use of multiple time frame analyses. (y) :idea:

Best regards,

WklyOptions
 
I quite agree that multiple time frame charting provides an edge in and of itself. The >80% ME that you mention is more than acceptable, but was it obtained with multi time frame MACD charting alone? That seems improbable. I would imagine these traders would, for instance, use a slow 14-bar stochastic as a confirming indicator. So long as the stochastic value remains embedded above 80% - or below 20% for a short position - one holds the position.

In fact I use a non-lagging implementation of the MACD with a lookback period determined by the period of the dominant cycle. The inherent lag of the "raw" MACD often misses two or more profitable bars!

On another point, I trade the exchange traded Globex foreign currency futures in preference to the OTC forex market because of the vastly superior leverage. Leverage can work both ways, of course, but with correctly placed stops, effective money management and a good ME - and fixed rate commissions! - currency futures are the optimal vehicle.

Best,
valleyvintner
 
Multiple Time Frame Charting

I quite agree that multiple time frame charting provides an edge in and of itself. The >80% ME that you mention is more than acceptable, but was it obtained with multi time frame MACD charting alone? That seems improbable. I would imagine these traders would, for instance, use a slow 14-bar stochastic as a confirming indicator. So long as the stochastic value remains embedded above 80% - or below 20% for a short position - one holds the position.

In fact I use a non-lagging implementation of the MACD with a lookback period determined by the period of the dominant cycle. The inherent lag of the "raw" MACD often misses two or more profitable bars!

On another point, I prefer the exchange traded Globex foreign currency futures to the OTC forex market because of the vastly superior leverage. Leverage can work both ways, of course, but with correctly placed stops, effective money management and a good ME - and fixed rate commissions! - currency futures are the optimal vehicle.

Best,
valleyvintner
 
I don't know what else to input. I always say there is no absolute truth. Some use MACD some don't, some trade the naked chart, some use digital filters ;) (ME!ME!ME!). The main thing is that you make it work. But I always looked at the indicators as a pair of crutches. Have not found one that works well all the time. How could they work well without tweaking the same way today, or in the crash of late 2008? or 20 years ago when markets were flat. There is usually an indicator for entry and not for exit. of course there may be on successful automated systems.
As for news agree with valley, always looked at those as some extra fuel for price movement, many times trend goes with them where it would have gone anyway, people just wait for them...and that's why they move the markets, because everybody wait and enter after them.
At the same time, I have to oppose myself. There are extreme cases, FED saying sg really bad, war breaks out, someone drops a really big bomb somewhere..then it does not matter if it was the perfect long entry 10 minutes ago into the most beautiful shaped obvious long trend, nobody would risk or think that this is paradise anymore, so the result would be crash. And those who doesn't listen to fundamentals at all, would scratch their head and try to look for a fitting resistance line to justify the abnormal move.
of course talking in extremes here.
All I am saying, it's all good if it works for you :)
 
Just counted how many "round turn" trades I had since Day 1.
So until day 23 the extra +2 spread cost me £72.6
About the same as much profit I realized.
Wel well well....
 
Day 24 (Week 5)
Month's plan beginning balance: £100
daily target is 5% (£5.00) (with the original plan)
base stake: £0.2/tick
max stake £0.8/tick

Account start balance: £50.00 (on 21 July 2014)
Current balance: £120.60

Account profit(net return):
original plan: 140%
boosted plan: 180%
actual: 141.20%

Win/Lose days: 23/1
Win/Lose trades: 136/128

********************************************
Well... I survived.
Original plan still followed.
Drawdown horrible.
Surrounding far far far from trading friendly.
Mother coughing horribly, baby screaming running around, wife grumpy as hell flat-mate chit-chatty, TV loud washing machine even louder, drank 2 beers, was half an hour late from start.

I really should rename this thread to Kamikaze Futures trading. I swear if I went to a trading room full of neurotic aggressive hyperventillating traders it would be like a Zen palace to me!!!

I could have stayed longer in the short... when I went all in on the top, I was thinking maybe the market will never be here again. But, had to decrease my risk, S&P tried another shot at breaking 2k level so got out of that one completely.
Also ever top-picker thinks the same like this is the very top and now I will make big bucks. This is not the way to think. Something is wrong with me.
Just imagine, last 2 weeks right? Market long all the way except 2 crash-y days.
If I were top picking I had to wait 2 weeks for this amazing opportunity, to enter short at the very top. Yeah ok. How much would I have made entering long after every divergence, and adding to the position taking partials? The answer is obvious. And plenty of time to enter short when short trend is confirmed trendline broken lower high etc....with much higher size since I got "rich" already.
But, I am still a dum'ass, so.... I keep shorting the long trend like it will make a difference and I get out after a couple of points of profit. Wonderful.

It really is a challenge for me, simple trading would be soo easy :D
I will call this place Stressmaster 2000. Sounds like a fitness machine xD.

Oh well, glad I am over it, this day, and it is about time to read my whole thread another time.
Of course I could ask whats first, eggs or the chicken
Am I overzealous (yes) to trade regardless of my surrounding, and would have made these trading decisions without the extra stress levels, or did that affect me? ...questions questions....
 

Attachments

  • 20140825profit.jpg
    20140825profit.jpg
    165 KB · Views: 142
  • 20140825c1.jpg
    20140825c1.jpg
    320.7 KB · Views: 124
  • 20140825.jpg
    20140825.jpg
    268.5 KB · Views: 143
Basic Swing Method

Are you aware of the method many futures swing traders use to appraise a trade and, if it passes muster, determine entry price, stop and price target?

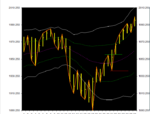
The attached chart is the Sep ES as at Aug 25 with an adaptive Bollinger Bands overlay. The dotted cyan line is a non-lag EMA with a 19 bar lookback. The green lines are 1 sigma from the EMA, the solid white lines 2 sigmas either side of the EMA - a zone that includes approx. 90% of the data for the 19 bar period.

The green line marks the point at 1955.00 on Aug 14 where prices met resistance and pulled back to support at 1937.25 on Aug 15 where the red line marks an initial stop.

A swing trader places a stop-in order so that when/if prices next take out 1955, as they did on Aug 15, the trade is stopped in at 1955.25, a tick higher than previous resistance. The initial stop is 1937.00, a tick below previous support. The initial price target is 1989.00, the upper 2 sigma band.

The orange Swing Lines aren't essential but they emphasize the key reversals of price movement that may offer trade setups.

An earlier upward zigzag similar to the entry point at 1941.00 doesn't qualify as a setup because it's below the EMA. It could easily turn out to be no more than a reversion to the mean. But if prices move above the EMA with the trending pattern - higher highs and higher lows - that we see in this case, then it's a real setup.

Being stopped in at 1955.25 with an initial stop at 1937.00, the trade risks 18.25 ($912.50) - more risk than many traders would take. But the target at 1989.00 offers a possible reward of 33.75 ($1687.50), a positive ratio of 1.85. So a highn risk trader would have gone with this trade.

And it works out well. The market hit the target, 1980.00 on Aug 20. At that point the trader liquidates 50% of the position, if trading more than one contract, and sets a break-even stop on the remaining 50% of the position. 1955.75 is enough to break even and cover costs. In this case the second zigzag completed Aug 25 moves the stop up to 1981.25, a tick below recent support.

The Aug 25 setup is a good one also. Risk-reward is acceptable and initial risk is 11.00, compared with the 18.25 risk of the original setup.

The method is effective for intraday trading also but requires the use of multiple time frames to locate trailing stops that are neither too loose or too tight.
 

Attachments

  • Sep_14_ES_Aug_25.png
    Sep_14_ES_Aug_25.png
    23.7 KB · Views: 160
oops forgot to mark my trades
here they are
 

Attachments

  • 20140825c1.jpg
    20140825c1.jpg
    307.3 KB · Views: 147
Top