Evening trading US shares

Hope that helps or is interesting.
Richard

yes it has thanks,

just a few more questions if you have time

1. in your example above i take it your exit was because of NSDQ's bid of 135 and UBSS bid of 74. Is the 135 and 74 the actual number shares they are willing to buy at this level? (it doesn't seem like a very large amount of shares.)

2. who are NSDQ and UBSS (market makers?)

3. Are these orders often pulled? (fake?)

One other question not related to your example.

4. What is your experince with level 2 with regards to stocks like AAPL RIMM and AMZN? (these are the stocks I'm trying to learn about at the moment?)

thanks
belflan
 
one more sorry

5. how many shares are likely to be on the BID or ASK on stocks like AAPL, RIMM or AMZN?

thanks again
belflan
 
1. 135 = 13500
2. Go to nasdaqtrader.com to learn who is a MM
3. Sometimes
4. That would take a long time to explain, sometimes they are fast sometimes not so; you need to watch them yourself.
5. Varies hugely, how many cars are driving down a road.........
HTH,
Richard
 
1. 135 = 13500
2. Go to nasdaqtrader.com to learn who is a MM
3. Sometimes
4. That would take a long time to explain, sometimes they are fast sometimes not so; you need to watch them yourself.
5. Varies hugely, how many cars are driving down a road.........
HTH,
Richard

thanks Richard,

straight to the point and very useful

cheers
belflan
 
BTW, there were other reasons for covering apart from the one you mentioned, but I'll leave you to figure them out, as I said :)
Richard
 
BTW, there were other reasons for covering apart from the one you mentioned, but I'll leave you to figure them out, as I said :)
Richard

hmm, not sure

had another quick look

maybe the ASK side drying up? maybe big order going through at 44.00? was this a sell or a buy (don't really understand this bit)

cheers
belflan
 
HI MR CHARTS,

if the accumulated total buy side is much higher than the total sell side, so long as the orders are not pulled, isn't the price heading down, i know this sounds the opposite to what we think will happen but scalpers i know of (scientist and speedscalper) use this technique. If you watch the dom it does work but only in the very short term, i don't understand why it works as im not that technical but it seems good for scalping anyway.
Just wanted to know your thoughts as to why this might work as you would think that more buyers means the price is going up


jason
 
Last edited:
every trade printing off is both a sell and a buy..........:)
Richard

that's the bit i couldn't get my head round on the T&S (the penny has now dropped:whistling)

was there any other reasons for closing trade other than those discussed above?

thanks
belflan
 
HI MR CHARTS,

if the accumulated total buy side is much higher than the total sell side, so long as the orders are not pulled, isn't the price heading down, i know this sounds the opposite to what we think will happen but scalpers i know of (scientist and speedscalper) use this technique. If you watch the dom it does work but only in the very short term, i don't understand why it works as im not that technical but it seems good for scalping anyway.
Just wanted to know your thoughts as to why this might work as you would think that more buyers means the price is going up


jason

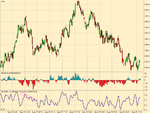
This is frequently true in stock index futures markets (until it isn't). See the attached chart of the DAX.

This is a constant volume chart with 100 contract bars. The bottom plot is the ratio of the total number of contracts at the ask (all 5 levels) to total contracts in the book (all ten levels). The plot is smoothed to get rid of some of the noise.

The second from bottom plot is the volume (number of contracts) executed at the ask minus volume executed at the bid - also smoothed.

If you think of this in term of supply and demand, there are four components - demand for shorts, supply of shorts, demand for longs, supply of longs. What is showing in the book is the supply of longs abd shorts. When the demand for longs exceed supply the prices goes up - even if there are more contracts shown in the book at the ask than the bid. The demand is represented by the T&S and and the executed bid/ask delta.

A related way of viewing it is that the market exists to facilitate trade. If you have a trading strategy using only limit orders, you place your orders where you believe the market will come to you and let the more agressive traders push price to that point. If the current "micro trend" is up, there is not a lot of point in placing a buy order below the market.
 

Attachments

  • dax_100contracts.png
    dax_100contracts.png
    23.6 KB · Views: 289
that's the bit i couldn't get my head round on the T&S (the penny has now dropped:whistling)

was there any other reasons for closing trade other than those discussed above?

thanks
belflan

I can tell you there was absolutely no other reason he closed that trade! The chart looked great. The Level II was the exit signal! And a very clear one!
 
??????????????????????????

Well, what is it that you don't understand?
You asked was there any other reason mr. charts closed that trade except the Level II or T&S.
I answered, NO! The only reason he closed that trade was because of Level II. Because when you look at the chart, it doesn't show a reason to get out!

-Dave
 
Well, what is it that you don't understand?
You asked was there any other reason mr. charts closed that trade except the Level II or T&S.
I answered, NO! The only reason he closed that trade was because of Level II. Because when you look at the chart, it doesn't show a reason to get out!

-Dave

i think you have misread what i'm trying to get out of this

????????????????

i'm picturing you actually shouting at the screen. are you?:)

cheers
belflan
 
i think you have misread what i'm trying to get out of this

????????????????

i'm picturing you actually shouting at the screen. are you?:)

cheers
belflan

Okay. haha. What are you trying to get out then?

haha, Me shouting at the screen? No, not at all. Why do you think that? I'm not aggressive at all. Except from my trading style! I'm very laid-back! LOL.

-Dave
 
read the posts


Not! sure! what! do! you! think!

cheers!
belflan!

It's all in the Level II. Compare the Level II screenshot of AMGN and look at the Level II of AMGN this afternoon when the market is open. Look at AMGN when it's not really moving and then try to find the big difference.

-Dave
 
jj121,
Ask your friends, but I would guess you are not talking about nasdaq or nyse stocks, but DOM on futures. That is like comparing oranges and carrots, both red, but vast differences.....

Nice post dcraig.

belflan, I think dvdh has covered it :)

Richard
 
jj121,
Ask your friends, but I would guess you are not talking about nasdaq or nyse stocks, but DOM on futures. That is like comparing oranges and carrots, both red, but vast differences.....

Nice post dcraig.

belflan, I think dvdh has covered it :)

Richard

Hi Richard,

just for closure on the above example

the reasons for exiting were;

1. Bid side strength
2. Ask side weakness
3. large order going though at 44.00 on T&S

In your view was there any others from the Level 2 screen (that I missed)?

thanks, this has helped with my understanding of L2 (sorry if the questions sound a bit newbie/silly)

cheers
belflan

i'm still trying to work out what dvdh covered with his posts:)
 
Top