You are using an out of date browser. It may not display this or other websites correctly.
You should upgrade or use an alternative browser.
You should upgrade or use an alternative browser.
JahDave
Experienced member
- Messages
- 1,563
- Likes
- 28
IMPORTANT UPDATE.........
It has been my experience that anytime a currency pair makes a very big high or low, then it will reverse for at least several thousand pips. The USD_JPY just made a 15 year low this morning, so hold on to your hat everyone because it is going to be a wild ride back up.
It has been my experience that anytime a currency pair makes a very big high or low, then it will reverse for at least several thousand pips. The USD_JPY just made a 15 year low this morning, so hold on to your hat everyone because it is going to be a wild ride back up.
4xpipcounter
Experienced member
- Messages
- 1,571
- Likes
- 30
Tucker has one thing to say to you, "rrrrrf, rrrrrrrrrfffff." That means, in dog language, "Leave my money alone, or you will have 3 limbs instead of 4."
I'm sorry I didn't trade the GBP,CAD, But I think that was a wave 1, so take Tuckers money.....
4xpipcounter
Experienced member
- Messages
- 1,571
- Likes
- 30
Sorry, I was off by 5 pips.
And then back to the abyss baby--.6999.
JahDave
Experienced member
- Messages
- 1,563
- Likes
- 28
Sorry, I was off by 5 pips.
It seems I was off by 2, it made .7077 on my charts
JahDave
Experienced member
- Messages
- 1,563
- Likes
- 28
IMPORTANT UPDATE.........
It has been my experience that anytime a currency pair makes a very big high or low, then it will reverse for at least several thousand pips. The USD_JPY just made a 15 year low this morning, so hold on to your hat everyone because it is going to be a wild ride back up.
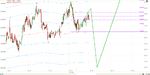
Here's where I think the JPY is. I am posting up a monthly chart so that you can see very long term. The USD must past the previous high of 1.45 area, but this will probably take at least several years. In the meantime, I have the pair finishing up an ending diagonal and if you notice it overshot and briefly broke through the bottom of the support line. One of my previous Euro posts from a month or two ago showed the exact same thing right before the Euro started it's march back up. I think there is a very good chance the USD slide against the JPY is over. If not then there will be one more small push down which should not be more than 150 or so pips down from where it is now. Of course I'm already long because I'm just a little impetuous, and I jump right in. The bottom line is this.........this downhill slide is over, or very close to over and then there is going to be a monster move back up.
Attachments
JahDave
Experienced member
- Messages
- 1,563
- Likes
- 28
Here's where I think the JPY is. I am posting up a monthly chart so that you can see very long term. The USD must past the previous high of 1.45 area, but this will probably take at least several years. In the meantime, I have the pair finishing up an ending diagonal and if you notice it overshot and briefly broke through the bottom of the support line. One of my previous Euro posts from a month or two ago showed the exact same thing right before the Euro started it's march back up. I think there is a very good chance the USD slide against the JPY is over. If not then there will be one more small push down which should not be more than 150 or so pips down from where it is now. Of course I'm already long because I'm just a little impetuous, and I jump right in. The bottom line is this.........this downhill slide is over, or very close to over and then there is going to be a monster move back up.
The USD_JPY is looking impulsive up on the 5 minute chart, so I am encouraged with it so far.
Attachments
JahDave
Experienced member
- Messages
- 1,563
- Likes
- 28
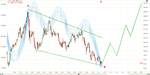
The EUR_AUD is ready to collapse tonight.
The charts say it all........ but ask any questions.
Attachments
JahDave
Experienced member
- Messages
- 1,563
- Likes
- 28
The charts say it all........ but ask any questions.
The EUR_AUD is in a wave three down which should be long and strong....
JahDave
Experienced member
- Messages
- 1,563
- Likes
- 28
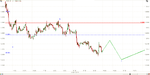
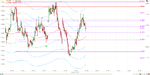
The USD_JPY is getting ready to go up for a wave 5 and then back down for a wave 2 on the next larger scale........After that it should start accelerating up............
This USD_JPY has some upward momemtum.........
Attachments
JahDave
Experienced member
- Messages
- 1,563
- Likes
- 28
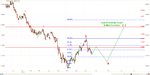
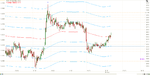
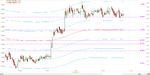
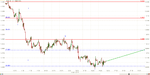
JPY Update. I'm out of my long because I think we are in wave 2 back down and wave 2 seems to be an expanding flat. The b wave of wave 2 is 138% the size of the a wave. If the c wave of wave ii is 138% the size of the b wave then it will end at the .8430. Also if you look at the fib retracement I pulled on wave i then you will see that the .8430 is exactly the 61.8% retracement of wave i. So I closed my long for a nice profit and I am looking to get back in long at the .8430 area.
Attachments
JahDave
Experienced member
- Messages
- 1,563
- Likes
- 28
JPY Update. I'm out of my long because I think we are in wave 2 back down and wave 2 seems to be an expanding flat. The b wave of wave 2 is 138% the size of the a wave. If the c wave of wave ii is 138% the size of the b wave then it will end at the .8430. Also if you look at the fib retracement I pulled on wave i then you will see that the .8430 is exactly the 61.8% retracement of wave i. So I closed my long for a nice profit and I am looking to get back in long at the .8430 area.
Also it appears that wave 1 on the next larger scale turned out to be a leading diagonal. Diagonals only appear in the first or last position of a wave.
Attachments
JahDave
Experienced member
- Messages
- 1,563
- Likes
- 28
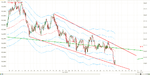
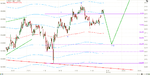
Euro update. I think the charts say it all, but please ask any questions
I have a slight revision to my forecast. I thought the Euro had one more push down, but after looking at how the candles have developed last night and today, I am thinking the Euro has bottomed out and is heading back up for several days.
Attachments
JahDave
Experienced member
- Messages
- 1,563
- Likes
- 28
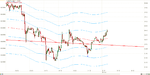
JPY Update. I'm out of my long because I think we are in wave 2 back down and wave 2 seems to be an expanding flat. The b wave of wave 2 is 138% the size of the a wave. If the c wave of wave ii is 138% the size of the b wave then it will end at the .8430. Also if you look at the fib retracement I pulled on wave i then you will see that the .8430 is exactly the 61.8% retracement of wave i. So I closed my long for a nice profit and I am looking to get back in long at the .8430 area.
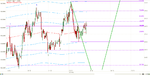
The JPY has hit the 50% retracement twice now and been rejected both times. I still think the .8430 will get hit before turning up for a large move.
Attachments
JahDave
Experienced member
- Messages
- 1,563
- Likes
- 28
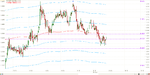
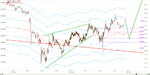
The JPY has hit the 50% retracement twice now and been rejected both times. I still think the .8430 will get hit before turning up for a large move.
I guess it wanted to make the 61.8%. It went exactly there to the pip.