E-Mini SP 500

Based on feel alone, its not a red box day today. 🙂 Its a yellow box day, stops more likely to get hit. So if you were starting out, you would sit patiently until a red box day feel comes back into the market. Thats how disciplined trading works, and maximizing reward/risk. It becomes extremely hard to loose money, when you stick to red box days. The problem with traders, is they feel the need to trade all the time.

Hello Xymox

I'm intrigued by the boxes.

Rather than trading 'outside the box', this is trading 'inside the box'.

How are these boxes constructed?
 
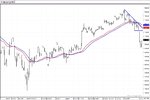
MA crossover buy signal again.
 

Attachments

  • 10222007-113229.jpg
    10222007-113229.jpg
    96.5 KB · Views: 165
Hello Xymox

I'm intrigued by the boxes.

Rather than trading 'outside the box', this is trading 'inside the box'.

How are these boxes constructed?

the boxes take into acct price and multiple external factors. But when MA's frequently cross intraday, its a tipoff that its a yellow or green box not a red box. Its a segmentation of a sentiment wave on the 60 minute chart. The 60 minute chart represents a sentiment wave, and at any moment in time, price is one of those three phases.
 
this principle can be applied to any market. Basically the easiest place to make money is on the first day of a strong move, the seond day is relatively easy, the third day becomes harder.

the yellow boxes represent instability in sentiment, hardest places to make money. The red boxes represent sentiment resolution a strong move/breakout, the green boxes represent late comers. And again consolidation occurs and a new sentiment battle takes place.

stops tend to get hit more in yellow and green boxes, red boxes stops rarely get hit when the trade is placed with the predominant trend intrady. New traders should only trade in red boxes, till capital is built up. The battles should be left for bigboys with agendas.

the goal of traders is to figure out which box are we in and trade accordingly.

the bigboys in most instances try to extrapolate out the red boxes to encompass much larger timeframes secondary to entry/exit constraints and liquidity.
 
sentiment wave segmentation of the 60 minute chart.
 

Attachments

  • 10222007-122725.jpg
    10222007-122725.jpg
    135.5 KB · Views: 214
after a double bottom on intraday, the reaction should have been more profound.
 

Attachments

  • 10222007-124652.jpg
    10222007-124652.jpg
    424.5 KB · Views: 215
there is immense petro dollar/natural resource wealth looking for higher rates of return then traditional methods, it will fuel one of the largest bull markets, culminating with the completion of our grand tower in our grand city.

the resurrection of the empire.
 

Attachments

  • wtc.jpg
    wtc.jpg
    38 KB · Views: 295
Last edited:
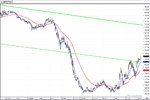
a break of that 60 minute trend line, is one of the strongest technical indicators for upside progression in this current pattern of bouncing off of support zone.
 
zig zag pattern, bullish with the bounce confirmation.
 

Attachments

  • grosspatt.JPG
    grosspatt.JPG
    16.7 KB · Views: 190
there is immense petro dollar/natural resource wealth looking for higher rates of return then traditional methods, it will fuel one of the largest bull markets, culminating with the completion of our grand tower in our grand city.

the resurrection of the empire.

..."Wars are caused by undefended wealth"- E.Hemingway...
 
ES intent still progressing along.
 

Attachments

  • 10222007-175935.jpg
    10222007-175935.jpg
    479.8 KB · Views: 188
covert buying...market is blatantly bullish.

its transitioned into green box.

price escape above 1540 expected.
 
Last edited:
there is immense petro dollar/natural resource wealth looking for higher rates of return then traditional methods, it will fuel one of the largest bull markets, culminating with the completion of our grand tower in our grand city.

the resurrection of the empire.


I passed by there about 8 hours ago.
 
the players on the ladder will spoof and hit their own bids with size, to give impression someone is hitting bids, but essentially themselves hitting their own bids, ultimate indicator is price.
 

Attachments

  • 10222007-195744.jpg
    10222007-195744.jpg
    45.2 KB · Views: 201
Back
Top