You are using an out of date browser. It may not display this or other websites correctly.
You should upgrade or use an alternative browser.
You should upgrade or use an alternative browser.
rols
Experienced member
- Messages
- 1,621
- Likes
- 336
1570 target by Fridays close.
Is this still such a certainty?
Is this still such a certainty?
doesn't look good... 🙂
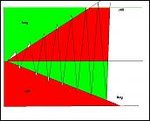
it turns to a red box day,... when the low breaks today 1494-92 zone....then selling without fear will ensue.
How can possible 'red days' be identified.
1) unexplainable moves or gaps in after hours trading
2) upcoming earnings
3) upcoming economic reports
4) notable speakers scheduled for the trading day
5) price at extremes of montly ATR
6) minimal retraces
7) multiple supports and resistances breaking
8) increased volume
9) unexplainable indirect market gyrations(fx/bonds)
10) TV media repeating the samething over and over intraday
how many of these were true...within 24hrs.
rols
Experienced member
- Messages
- 1,621
- Likes
- 336
doesn't look good... 🙂
it turns to a red box day,... when the low breaks today 1494-92 zone....then selling without fear will ensue.
Stranger things happen!
I'm in LONG from 1501.50 currently for a quick scalp back to YL1510.25
...that 1570 is looker a lot closer.😀
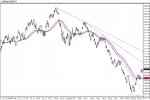
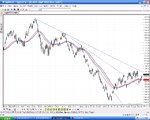
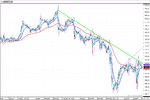
60 minute trendy has to break, then flood gates open.
Attachments
Similar threads
- Replies
- 16
- Views
- 6K


