E-Mini SP 500

getting back to the main thread, why did selling take place 1 week before the FOMC meeting, my estimation looking at all the factors, the MM's needed liquidity to load up for FOMC day, it should test the 1545 area on FOMC, once we get there, we will be into the holiday season, Christmas rally could ensue breaking stops again above up.. possibly touching 1620.

the world CB's and FED will flood the markets with liquidity.
 

Attachments

  • 10212007-142138.jpg
    10212007-142138.jpg
    448 KB · Views: 176
this principle can be applied to any market. Basically the easiest place to make money is on the first day of a strong move, the seond day is relatively easy, the third day becomes harder.

the yellow boxes represent instability in sentiment, hardest places to make money. The red boxes represent sentiment resolution a strong move/breakout, the green boxes represent late comers. And again consolidation occurs and a new sentiment battle takes place.

stops tend to get hit more in yellow and green boxes, red boxes stops rarely get hit when the trade is placed with the predominant trend intrady. New traders should only trade in red boxes, till capital is built up. The battles should be left for bigboys with agendas.

the goal of traders is to figure out which box are we in and trade accordingly.

the bigboys in most instances try to extrapolate out the red boxes to encompass much larger timeframes secondary to entry/exit constraints and liquidity.

so what box are we in, ..................its still a red box.
 

Attachments

  • 10212007-142617.jpg
    10212007-142617.jpg
    20.3 KB · Views: 180
Last edited:
so what happens in red boxes....sentiment crystallization...multiple pivots break, unidirectional volatility. Notice how the MA's dont cross after support break.
 

Attachments

  • 10212007-153131.jpg
    10212007-153131.jpg
    63.9 KB · Views: 202
Greenie rocks hes talking about SWF's live now on Bloomie..hes saying the same something...that I am.
 
How can possible 'red days' be identified.

1) unexplainable moves or gaps in after hours trading
2) upcoming earnings
3) upcoming economic reports
4) notable speakers scheduled for the trading day
5) price at extremes of montly ATR
6) minimal retraces
7) multiple supports and resistances breaking
8) increased volume
9) unexplainable indirect market gyrations(fx/bonds)
10) TV media repeating the samething over and over intraday
 
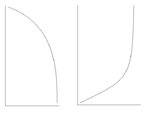
parabolic cascades, are prime inefficiencies. Lot of the times these types of patterns persist only intraday. But in euphoric and fear markets the patterns repeat on long term timeframes.
 

Attachments

  • paraboliccascades.JPG
    paraboliccascades.JPG
    15 KB · Views: 168
immense orderflow can be used to destroy the psychological basis of price, if you watch the current tic action, you can see it at work....basically price has to prove itself, there is no point in stepping infront of the price instability, and that the goal of MM's to create severe psychological price instability, so that massive liquidity can be used to cover, the positions accumulated in destroying the price.
 
when price reversal occurs you can look at the quantity below the reversal traded, to determine what it took to reverse the price.
 

Attachments

  • quantityreversal.JPG
    quantityreversal.JPG
    24.7 KB · Views: 176
usdjpy...reversed already. No clear buy signal yet. 🙂
 

Attachments

  • 10212007-211034.jpg
    10212007-211034.jpg
    95.8 KB · Views: 164
if futures turn positive, a bunch of players are going to get screwed..majorly...as the FOMC clock tics down.
 
updated 60 minute, buy signal only gets triggered when we bust that green line.
 

Attachments

  • 10222007-022013.jpg
    10222007-022013.jpg
    451.8 KB · Views: 181
two charts one is the current real, and the other possible future.
 

Attachments

  • futureESprob.JPG
    futureESprob.JPG
    139.6 KB · Views: 182
  • 10222007-025620.jpg
    10222007-025620.jpg
    516.3 KB · Views: 194
MA buy signal. Buy signal only valid when 60 minute trendy is upward biased.
 

Attachments

  • 10222007-095242.jpg
    10222007-095242.jpg
    89.2 KB · Views: 190
since 60 minute trendy is down, MA looks like they will cross. Will lead to sell signal, lets see if we can capitalize on the sell signal.
 

Attachments

  • 10222007-103752.jpg
    10222007-103752.jpg
    91.6 KB · Views: 184
Based on feel alone, its not a red box day today. 🙂 Its a yellow box day, stops more likely to get hit. So if you were starting out, you would sit patiently until a red box day feel comes back into the market. Thats how disciplined trading works, and maximizing reward/risk. It becomes extremely hard to loose money, when you stick to red box days. The problem with traders, is they feel the need to trade all the time.
 
Back
Top