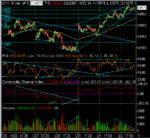
Dow Intraday Charts 31 Jan - 04 Feb

VSATrader said:
I see supply coming at these levels, and although it may tick a bit higher, if you look at the Dow daily, you will see a top reversal in the background.


www.vsatrader.com
I quite agree but the fact is that today the Dow has gone above the previous top and is currently at 10574, shrugging off the weakness in the background. Now what will happen next is the event to look out for.
 
SOCRATES said:
But this is going to go higher, Chartman.
It has gone up as promised, Chartman, and, against all logic too, very peverse is it not ?

Currently at 10577.40 ~ I am not predicting, just commentating, as I am following your good advice not to predict.
 
And now, just to be perverse and contradictory, it has climbed further to 10584.10 Ha ! Ha ! Ha !
 
Socrates,

It had to get up here to reach the target for my chart in post 3 above 🙂

I don't mind if it goes back down now.
 
That's OK, it can go higher still, just to please you, currently 10588.40 and lifting gently.
 
SOCRATES said:
And now, just to be perverse and contradictory, it has climbed further to 10584.10 Ha ! Ha ! Ha !

I dont understand why it is "perverse and contradictory" for the Dow to go UP !!

It is only perverse if you have a pre-defined expectation for its behaviour, and surely we all know to trade what we see rather than what we want to see.
 
GKB said:
... fascinating conversation🙁
You have just reminded me of something.

In Special Forces they have a saying:~

When for example they get themselves in a tight corner, for instance, bedded down in a sangar with bullets going zip, zip, zip, crack, overhead, the following is invairibly uttered....

"Well, if you can't enjoy a joke, well then, you shouldn't have joined......should you?".
 
Old Bill

bb02a.JPG

Its now 10594 up43 points

HaHa!
 
Rognvald, that is exactly what I meant ! The older you are, the more significance it has.
 
Well - the occasion merited a temporary return from the Northern fastness. You are 15 min late & the fun is over. Submerging again now!
 
A rising wedge channel developed over the last 3 sessions – a break out could be significant imho

😕
 

Attachments

  • 02-02-05.gif
    02-02-05.gif
    20.3 KB · Views: 250
No weakness that I can see.... 🙂
Couple of comments.
The 5 point stop loss. In my opinion, unless you are very skilfull, having only a 5 point stop on an entry will mean lots of small losing trades. This may suit your personality/bank account.. Those less skilfull will benefit from a wider stop.
Wecome to Rognvald indeed. I didn't realise you popped in here.....
Socratees- My comment about the high only referred to yesterday's action. As you know, I'm not interested in tomorrows predictions.... Having said that, and with reference to 'Art' on another charting thread, drawing in trend lines that reflect some trutghfulness of expectation requires a degree of luck and a degree of experience. Go back and take a look at last night's 10 min chart to where I have drawn an 'imaginary' upper resistance line.This extrapolates out today to around 620. :cheesy:
 
Hello Chartman, on the topic of stoploss, in reality those who are still learning actually would benefit from the reverse. Their stoploss limits should be even tighter than what you suggest. This is because they are likely to get it wrong more often, until they gain proficeincy. This has two benefits. the first one is that the balance is not depleted at a fast rate and the second is that hopefully it would encourage the selection of better entry opportunities. On becoming very experienced, then it does not matter for the expert to use stops or not, but for beginners and the not so advanced I think it is crucial.

Rognvald is obviously very busy so we must assume he can only afford to put in very brief appearances.

I know you are not interested in predictions, but I very firmly am. However, I am taking your advice and not predicting, only commentating. If I do this in real time, that is alright is it ?

My reference to an "Art Form" on another thread means just that. This is because there is a universal attempt to quantify all of this rigidly in some way or another. It is not like that at all, although some people can persuade themselves and others it is so. The dilemma is multiple in its complexity, because on the one hand, reading the market correctly requires a firm base of knowledge followed by the application of reasoning and logical deduction, but, this is not enough, it requires much more. Also there is the pitfall of a temptation to read into a chart what the reader chooses.

I am indeed grateful to you for advising me not to predict. This is not, because as is patently obvious I cannot, to the very contrary, as has been proved repeatedly, but because it exonerates me from the burden thereof.

I take on board your comment about the 10 min chart and I have looked, with interest, I may add.

You aare again right in what you say about drawing trendlines. It is very much the same problem that exists for many people in interpreting a chart, and in fact, drawing the trendlines, for some it becomes an extension of this problem, which is one of perception.

I am not predicting again, just commentating that the weakness I commentated on in post number 37, above, has come in again, the level is now at 10, 574.20 the previous burst of bullishness in the background now having been exhausted.

Kind Regards as Usual and Have a Good Evening.
 
Back
Top