Dow Intraday Charts 29 Aug - 02Sept

Wednesday 1st September 2004

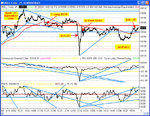
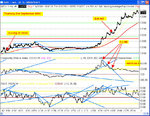
Opened gap down, closed then down again to new lows. Lacking direction ahead of 10am numbers.

10:03 Triangle breaks to the upside with TLB on CCI. Goes up to take out yesterday's high but volume looks weak. More upside soon kicks in though and ends up being strong move up - possible wave 5 carrying over from yesterday as it moves in on the recent resistance above 10200.

10:30 Fifth wave appears to have completed around 10208 (three peak ND on 5 minute chart too). This probably makes any further long entry risky now but it could still make an attempt on 10235 - the recent high.

11:11 Pulls up again after meandering sideways after wave 5 peak. Came close to 100 ema but no trade taken.

11:31 Price hits 100 ema for first time but showing no direction at the moment although horizontal TLB to downside on both RSI and CCI (quickly becoming O/S though).

11:36 TRADE ENTRY Long at 10178 on move from O/S and yesterday's high just below 100 ema (against possible 5th wave peak and recent highs above though). Soon breaks down into loss and looks like short was the way to go based on my earlier analysis. Pulled back to small profit but just formed bearish looking flag which broke swiftly to downside.

12:25 Break to upside out of channel and back above 100 ema. Needs to hold and follow through.

13:03 Sharp break to the downside and back below 100 ema - terrorism alert - great!

13:07 TRADE EXIT: Stopped out -25.

13:20 TRADE ENTRY: Short 10152 - ludicrous fill - at least 10 points off price showing following retrace to 100 ema. Seat of pants now - IB prices frozen. Market flattens out at 100 ema but with me at big big loss due to the fill.

15:20 Did eventually pull down into single digit profit but heavily oversold and bounces back up off small PD over 7 or 8 minutes. Holding for a bigger move down and proper triple PD. Might have had the best of this move already though. Stuck in congestion but stubbornly refuses to make third lower low and then bounces hard into losing position. Jeez. Up up up into the close. Shocking.

TRADE EXIT: Just before close -15

Total for day: -40 from 2

Total for month: -40

Very frustrating. Welcome back from holiday.
 

Attachments

  • 20040901.jpg
    20040901.jpg
    211.1 KB · Views: 224
Just one thing that caught my eye from GKB's post today:-

These days I don't keep longs after hours due to the "terrorism factor".

Remember when they caught Saddam..? - it was out of market hours, and it opened over 100 up..!

If they caught or neutralised Bin Laden, the effect could be the same...(or better....!)

Just to put 'risk' in perspective.......... ;)

ps - CM, excellent post #38......!
 
Last edited:
Hi

CM - Nice post. I agree everyone should be encouraged to post successes and failures. It's amazing how much you learn just by commenting on your own trading. [In my case I learnt : "stick to yer day job!]

Today

A Rule 2. Missed this as I don't get home until after 5:00pm. I did go long just after 5, saw a bit of pd. 10172. This got to about 10 point in profit before the news spike took the stop for -20.
Should have rolled the stop to BE like I usually do.

I did take a long at 10115 which set me up for the day. That was pure luck but it put me in control of the rest of the day. Closed half at 10165 and the other at 10170.

B Long at 10152 Rule 2. Went into profit so I rolled the stop to BE. Stopped out.

C Long Rule 2 from 10149.

D Closed at 10162 +13 points Rule 1.

Comment
1 Notice how 10170 changed from supp to res after the spike.
2 I'm getting a bit fed up of entering a trade, seeing it go into profit, rolling the stop to BE then watching the stop get taken. I must be doing something right on the entry but the 'Rules' for exit are not being met.

YESTERDAY

I'va attached the chart [I'll leave you to decide which is which] but I didn't trade yesterday. If I had I think I would have scrapped the +-15 ema rules because of the down trend at start of the day.
Please notice how the price follows the -15 ema100 line downward followed by two bounces from it before the upturn. I am sure this is significant but I have no idea how to turn it into a successful trade.

Regards

Bill

+-15 ema Rules are

1. Short if price crosses 100ema and touches/crosses 100ema+15
2. Long if price crosses 100ema and touches 100ema-15.
3. Short if nd and/or price is 100ema +15 [or v close]
4. Long if pd and/or price is 100ema -15 [or v close]
5. Don't trade in the 1st hour
6. Stop losses above/below obvious SR
 

Attachments

  • dow_010904.gif
    dow_010904.gif
    31.9 KB · Views: 185
  • dow_310804.gif
    dow_310804.gif
    33 KB · Views: 193
01/09/2004

Hi,
It's my first time pasting charts, so bear with me please. I hope the chart comes out OK. The times are in US Eastern Standard Time, sorry, you'll have to add on 5 hours for our time.

Using Interactive Broker a/c, primarily for scalping on the Dow ...
Carried 3 shorts o/n
#4 short @ 15:16
#5 short @ 15:22
#6 short @ 15:28
closed all 6 shorts @ 18:14 for -5, +12, +27, +41, +48, +55
then started again..
#1 short @ 18:21
#2 short @ 18:38
closed these 2 shorts : 18:38 for +7, +18
Towards the close, I've reopened a short
#1 and #2 combined @ 20:45.

Total profit taken today ... 203
Current positions, -10, -10 @ 22:00

Be better with a chart but here goes,
Fed #4,#5,#6 positions towards the morning peak. Oversold on most time frames, negative divergence on 10 min RSI, good 3rd resistive volume spike making an EW 5 wave complete.
Thought (and still do) that we're now pulling back for at least a fib retrace of the rise from 10075, so looking for at least 38% = 10127. This last 5 wave up could very easily be the last 5th wave of another 5 wave series from early September (9750 or so) in which case we've got at least some serious fib retraces down to come. This whole 5 wave up from September is likely a retracement C wave, so looking for much further south in the next few weeks. Target of 9500 or lower have been mentioned; quite possibly we might be about to start the fabled big 3rd wave down. Elliott wavers differ on this, as there may be room for another spike up to the 11,000 level but only once this latest drop turns around at about 10,100. I must remember to be out of the market then:)

Basically, got the short targets with the news spike down and closed out. Then got back in short with the rebound when it settled down with the adx flat on the rise. Took a quick scalp. Then got back in short for 2 positions at the end of the day.
Overall, nothings changed with the market, it's just been a swinging day with the news. I do think the news spike down shows just how jumpy the market is.

By my own rules, I should only have fed in one short position at a time, but at the end of the day I'm afraid I got carried away.

If the Elliott Wavers are right there's going to be a huge drop coming soon, yes I know they've been saying it for months :rolleyes:

Tomorrow's another day :cheesy:

EDited by CM- I've attached the chart as a Gif as well.
 

Attachments

  • 01092004.pdf
    37 KB · Views: 290
  • Image1.gif
    Image1.gif
    56.1 KB · Views: 198
Looks like Legoland the best option today, pretty tricky by the look of the charts.
Sorry Hooya, didn't find your hat :LOL:
 
TradeSmart,
Fair point,
Imagine what the markets woud do if there was a chemical, biological or nuclear attack in the West?
Puts things in perspective for me.
The Chechnyan's (is that how you spell it) have been doing their own thing without BinLaden, that could very easily spill over to us, whether or not he's caught.
God, I hope not, but that's the risk I see.
 
Hi FC

spot on with the numbers ;)
It may be worth adding a dissclaimer along the lines of " this is not an invitation to trade " as chartman has pointed out there may be times when its wrong.

CM what FC posted was a calc not just a guess, its always better to know where you are happy to get on and off prior to the action would you not say?
 
DC/FC. I agree. If I read/interpreted your post wrong, I'm sorry. It's far more important to have a line in the sand than no line at all....... However you arrive at your SR levels is not as important as knowing where they are ( or you think they are) and acting accordingly.It doesn't help if you are a mile out though. :(
 
So, bearing that in mind, I calculated last night that the move should go to 190 ish. So when I see 200 ish and OS, it's time to bale out of the long.Next target for tomorrow will be from the "W" formation ( or Inv H&S). This has to get to 220 to meet target. If it does, I'll be looking at today's action as a bull flag with a target of 270 ish. Let's say 264. :cheesy: So if the price makes 220, it should make 270. So if it get's wobbly at 232, don't panic out.... unless you want to, of course. Think about it, and make your plan based on "what if, then what?".... 140/150 should be your support/stop level.
 

Attachments

  • dow 01-09-04 10.gif
    dow 01-09-04 10.gif
    37.7 KB · Views: 232
From above, the long exit at the top should have been in your mind from yesterday.... Was the following TA a bear flag or a triangle? mixed signals ... Either way, do the sums for both and you get the same target- 170 at T2 !
Staying out when the news hits.... can you guess why? With SB,if you get on the wrong side, you'll be lucky to get out with your shirt intact.... I've mentioned before how to play these IF you get caught the wrong side. Such a steep violent drop will always ( :cheesy: ) recover to status quo.... But it can frighten you RIGID. The bottom pick is usually an excellent low risk trade.... but you have to take your cue from ES ( or YM) and vol. From ES vol, you can see the vol dry up progressively as it gets to the bottom. The first up bar from here is the place to get in safely. You can try and guess it before , but no point in being a hero...
 

Attachments

  • ES Vol 01-09-04 1.gif
    ES Vol 01-09-04 1.gif
    19.3 KB · Views: 200
  • dow 01-09-04 1.gif
    dow 01-09-04 1.gif
    25.3 KB · Views: 215
message understood CM, apologies for leading you up the proverbial.

DC defended my case well. i was offline until just now, and only just read the fall-out.

i wont make any more calls on this thread then.

yesterdays late action seemed to have broken us out of the downtrend the existed for most of the day. so i would expect things to be bullish, certainly at the start of the day.

last few days action offerspossibility of making another assault on wednesdays high. and i would anticipate this being broken today with a fake breakout, followed by a sell-off into friday. accordingly i will be a seller in the 10,230 and above region looking for a move south below 10,200 again.

here endeth the calls :)


good trading all.

FC
 
No fall out, just my mis understanding, and carry on with the calls- it's not my place to censor or dictate any genuine contributions to the thread.Honestly.
 
ok CM, here, have a Fruit Gum.

i'll try to rationalise my "calls" a bit more, certainly with a bit more TA, and not as much hocus pocus.


just you lot wait til i get my teeth into Delta too. ChowC has aroused my interest. Fnar Fnar..

ahem

FC
 
Thursday 2nd September 2004

9.38 TRADE ENTRY: Long at 10166 on first pullback off 100 ema. Moved up nicely off entry taking out high on second attempt. Numbers at 10 am could cause problems though and prices struggle to stay above previous high. Moved up on numbers without any great surge. Possible three peak ND but the first is from open so needs to be discounted. Then it drops like a stone! Pushed up again but failed to take out high. Wedge forming in RSI could give room for another push to the upside. Then did get a messy ND but decided to hold as action very unclear. It came back down but without any real conviction. Bit messy but upside still looks stronger than downside. Ascending triangle/bull flag forming on ND with volume declining. And then it breaks to downside (still no real volume though). Could probably exited at top of triangle/flag and waited to see next action.

10:59 New HOD on index and breaks to upside. Needs volume with T1 around 10230. Butt ugly bar on ES. Either a fake out to the upside or a quick return move before more upside. Looks horrible though as prices drop straight back into the flag area. Upside momentum killed dead now.

11:12 Dying on me now and right back to 100 ema. Break to upside clearly a fake out but I didn't see an exit. Now below 100 ema. How I've made a mess of this. From +33 and looking great all the way back to a tick or two from entry.

12:08 Pulls back to 100 ema from below but has used up a huge amount of RSI movement to get there. Eventually crawls above ema but very slow.

13:01 Breaks back below 100 ema, then back up again.

13:48 Possible break to the upside but again using a huge amount of RSI straight into heavily O/B (although that could be because price has been in such a tight range for so long - any subsequent movement gives big swings on indicators). T1 must be around 10195.

14:13 Moves through to new HOD at 10208 - yesterday's HOD and possible T2 from move from 10174 (flag at 10192). Peaks at 10216 before sharp pullback from heavily O/B. A really clear three peak ND exit over the next 30 minutes or more would be wonderful now!

14:32 Next peak and it does have strong ND on RSI and CCI. Projection would give third peak at 14:48. Price pulling back a bit more aggressively from this peak though.

14:48 TRADE EXIT: slightly late on third peak with ND for +60. CM's analysis would say I'm out too soon, but I'll take that as a clear exit signal to get me back on track after yesterday. With more experience in this approach and the clear underlying upside strength through the day I would perhaps have kept half my positions running at this stage as more upside seems instinctively highly likely, especially being right at recent daily highs.

14:51 Yep - straight up to new highs! Looks like CM was absolutely spot on. Great call!

Ah well, I'll call it quits there tonight and hope for a good day tomorrow.

Arrggggghhhhhhhh!!!!

+60 from 1

(+20 for September so far)
 

Attachments

  • 20040902.jpg
    20040902.jpg
    194 KB · Views: 207
Tony- good call, good analysis . Apart from the analysis last night which seems to have been spot on, the 10 min triangle gave a target of 266- lets call it 264 :cheesy: That's what I calculated yesterday. 2 different TA targets, same result- has to get there. 220 flew by, 232 never got a look in, so 264 was the only result.
Now at well OB, we might have to look at some new channel lines . We are at mid channel now, but it ought to be top line resistance so I shall have a rethink, but nothing looks obvious, yet...
 

Attachments

  • dow 02-09-04 10.gif
    dow 02-09-04 10.gif
    35.6 KB · Views: 183
Chartman, well done! I thought you must have found the same crystal ball shop as FetteredChinos! :LOL:

I made a few mistakes today (of course with hindsight etc):

Point A. I usually like a bounce up off 64 as you may know. I didn't take it today as I was wary of the news due out at 10:00. Oh well.

Point B. Look at that RSI, I know you should beware the diveregence at the open but the higher highs on the price were being met with lower and lower highs on RSI - maybe a warning signal?

Point C. Divergence or not (maybe it's an "only way is up day"), the price finally broke 200 so I jumped in with a long .. big mistake, price straight back down and an exit for me.

Point D a bounce off almost 64. Can't believe I missed this especially with my fondness for these! That must have been "trade of the day".

Point E. Looked like a flag which had broken to the downside. Went short, mistake, out again.

Point F. Looked like push 1 of 5 and maybe the 264 target CM had mentioned so went long. Good move, but I counted five pushes and got out at 257. Another mistake, I should have stayed in. I thought they came in fives so did I count wrong or does a push up this big take a lot to stop it? Or should I have looked for a 3pk ND?

Made a profit but poor considering what could have been.

Justyn.
 

Attachments

  • chart.gif
    chart.gif
    20.4 KB · Views: 206
Justyn, I think you have to distinguish between a tiny "breather" and a pullback when wave counting. You certainly have to ignore the 3 pk nd's...... My take is waves 1-3 take us to T1, taking in the bull flag.But then what?....
Trader Tony- that ND was a good exit, but shouldn't you have been prompted to get back in as 32 went by at 19:56?

Anyway, self explanatory tonight. It certainly is nice when a plan all comes together. Looks like post market has dropped 45 odd points from the close :( A bit of bad news somewhere, maybe...

PS: Note I included yesterday's close in the calcs for the bull flag target T1 because the open followed on from yesterday without gapping either way.
 

Attachments

  • dow 02-09-04 1.gif
    dow 02-09-04 1.gif
    27.9 KB · Views: 223
Interesting accounts chaps and good call yesterday CM......!

I refer to the 1min chart to ‘fine tune’ entries/exits, but often find that the 5 min chart gives clearer signals with far less ‘noise’ on RSI and CCI, with a nice 3-peak ND to show the way out at the top tonite….fairly typical after a strong rally…

But 2-peaks is usually the max on consolidation days I've noticed.....

I reckon the market must be expecting strong NF payrolls figures tomorrow…..hope it’s not disappointed……… :confused:
 

Attachments

  • 02-09-04.gif
    02-09-04.gif
    14.5 KB · Views: 186
Top