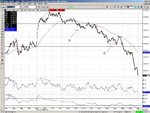
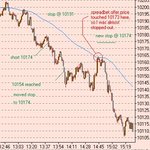
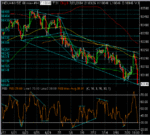
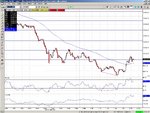
Yes, I can see the PD's. The thing is ( and this is easy to say) not everything is black and white. You need to see the overall picture and keep in mind what has happened. ...We had a huge breakout- a case of "too much too quick". I haven't had call to mention that for a long time. There was the almost 100 point gap up. Most would say the gap had to close... I think the key issue today was recognising the total weakness in most of the RSI rises. This would encourage me to allow more leeway in the pullbacks and monitor them closely looking for signs of strength.
The first divergence was likely to re-test 200. The second was likely to re-test 164. I understand your reasoning , possibly,behind the second long-being the point at which the gap closed.
On balance, a difficult call. One can't just take one situation in isolation and make a decision. There are so many things that one can look at in any given situation to form a balanced view, that sometimes the most obvious ( with hindsight) get forgotten. I am not free from guilt in this respect. It's no consolation,but the core rules will, on balance, serve most people very well.
One final point that you may not have read about.... closing a trade on the divergences is usually the optimum place to exit. It is NOT usually the optimum place to reverse the trade.You must wait until later confirmation .....


