You are using an out of date browser. It may not display this or other websites correctly.
You should upgrade or use an alternative browser.
You should upgrade or use an alternative browser.
One Eyed Shark
Well-known member
- Messages
- 257
- Likes
- 13
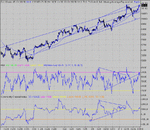
Long here from 10066 ( actually traded 10036 YM ) .
My finger is poised on the sell button ready to reverse though happy to sit tight at the moment 😕
3 and 5 minute charts showing potential for a bullish triangle.
Target would be 10125 though needs to break very soon if it is going to happen
My finger is poised on the sell button ready to reverse though happy to sit tight at the moment 😕
3 and 5 minute charts showing potential for a bullish triangle.
Target would be 10125 though needs to break very soon if it is going to happen
Well not very long!! Bloomberg radio is already talking about the Dow on its way to the highest close in 18+months!
What kinda market is this? Difficult to trade (at least for me). But change is in the air. best to worst performing indices are: DOW, SPX, $MID, NDX, $RUT&$SML That is reverse from past 9 months. Ok, I hear you say, that's because of US$ weakness but $ has been weak for a while (€$ was at 1.10 in March and August).
Yes, DOW strength can perhaps be explained by USD weakness but the weakness in the mid and small caps not?
Please share your insight? Is it time to consider positioning for a slide? Perhaps best to wait and let the market guide us?
tradesmart
Experienced member
- Messages
- 1,286
- Likes
- 22
Had a small short from 10080-60 earlier (small being the operative word! 😕 )
Now I see that the Naz & S&P are off their lows with PD bottoms on the 10min charts (Dow didn't follow so low due to Industrial Production numbers + rotation from techs imho)
Tradeable upside break later..... ??:!:
edit - the market had a bit of a 'two-faced' celebration of Saddams capture yesterday, but maybe this factor could be seen as meaningful for US consumer/industrial morale in the coming months, along with some very +ve economic data......maybe the market will just celebrate a bit late....?!?
I'm not a trained analyst by the way..... :cheesy:
Last edited:
tradesmart
Experienced member
- Messages
- 1,286
- Likes
- 22
Well, support at the magic '64' ish worked well again - suspicion of an inverse H&S now.....
double-top at 10135 ish anyone...........?!? 😱
double-top at 10135 ish anyone...........?!? 😱
tradesmart
Experienced member
- Messages
- 1,286
- Likes
- 22
It's like watching some exotic form of wildlife
bull....? or has it just become a bear - it seems to be schizophrenic..... 😉
tradesmart
Experienced member
- Messages
- 1,286
- Likes
- 22
Well, once again they 'sell the news' one day and buy it 'cheap' the next........... 😕
But, don't question it, it makes sense to them, and is so predictable it makes for simple trading........ 😉
ND double-top anyone for a mild downtick? (but won't trade it until I see it happen)
There might be bulls about........ 😎
But, don't question it, it makes sense to them, and is so predictable it makes for simple trading........ 😉
ND double-top anyone for a mild downtick? (but won't trade it until I see it happen)
There might be bulls about........ 😎
Similar threads
- Replies
- 3
- Views
- 3K

