Dow Intraday charts 12/Jan - 16/Jan

Such is the life of a stock trader, One Eye. That's why I gave up a long time ago on stocks. I don'dt think there's any books that can help you out on this one....
EGG is in the Dog's doo doo, MBNA is interested in buying that Doo Doo, EGG goes up 35%. Such is the price of Dog's doo doos. Defies analysis.
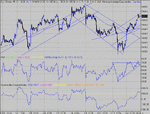
Back to today.... I nearly put in an uptrend line last night on the 10 min chart , and then thought better of it..... Well, I don't have a choice now.I'll assume that the trend slope is going to go back to status quo, to continue it's original slope. So what we got is a correction.The lines are a best guess, with very little to go on.If the guess is correct , then we're at resistance.What of the triangle in RSI? There's a small amount of headroom to get a break, but 80 is tops in recent times. That's worth a potential 60 points to 10, 600. Where have I seen that mentioned before?
The 50 point drop has just showed on my ESh ( 1132 to 1127). Interesting times.
 

Attachments

  • dow 14-01-04 10.gif
    dow 14-01-04 10.gif
    31.1 KB · Views: 589
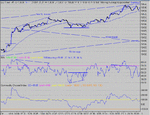
The opening play shows clearly the dangers of assuming a reversal at the opening, based on divergence, won't always work. It worked yesterday. Today, I was waiting for the third peak and it never came. Well, it did, eventually, at 510, but the time had long since expired....( around 16:00). Nevertheless, it did deliver,but only a 20 point drop. Hardly any strength on RSI with the 80 to 20 drop. That had to be a clue that a drop was unlikely from the trend breakout.The triple bottom at 480 signalled the long. Check the divergence slope change just before the breakout. What a gift. I know many say there are no leading indicators. Very true, but there are leading TA formations that should and do ring bells. It's difficult to predict a reward here, but the risk is as minimal as you can get with 480 as a stop for the long.
TS had some good ideas on targets today, I guess he saw something I didn't. :cheesy: Nice one.
 

Attachments

  • dow 14-01-04 1.gif
    dow 14-01-04 1.gif
    25 KB · Views: 479
CM - is that two 10min charts you've posted or am I pie-eyed again :eek: (it's all these long hours at the screen, honest!)

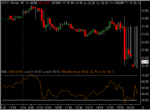
Slightly off topic, but we mentioned Intel's performance after hours - it looks a bit like the Dow after Sir Greenspan has made a speech.......! :LOL:
 

Attachments

  • intc.gif
    intc.gif
    11.4 KB · Views: 551
One Eye - its not the expected number but future projection that moves the stock. u can beat 20 estimates (relating to the past really) but if project a decrease in capital investments e.g. the issue will get thumped. i do not think any chip maker can commit to the present rate on capex for 2004.
 
Dam. I picked up the wrong gif. I can't correct it til later, sorry.
It's now the correct chart. :eek:
 
Just to add to the 10 min chart - the upper uptrend channel and horizontal resistance @ 10,580 about to meet ?

Shld be interesting anyways.
 
well, that would have been 100 odd points in th ebag if I hadn't chickened out and close when it dithered arnd the 100 MA :(
 
i thought this was going to be a v bottom and went long at 10495. sl below low of day, i think. anybody any clues
 
yeh, i banked on a V bottom too - closed it when that didn't happen - reckon a bear flag on 5 min - looking to short it bounces of 100 MA which is where I reckon the bear flag will be fully formed.
 
short from 509 - 100 MA test - i think it failed but if I'm wrong then stop is at 100MA + 20
 
Is it gonna get trapped in the 100MA? 5 legs down and each target not quite met before a pullback .Looks a weak drop. Equally little strength in the rise so far. Sit and wait, or stay out. Close bounce off the estimated 10 min support from last night, currently at 495 ish.
 
cm, how is that trget derived. sorry if it's obvious, can't see it

How does the slope change affect it?
thanks in advance
 
Top