You are using an out of date browser. It may not display this or other websites correctly.
You should upgrade or use an alternative browser.
You should upgrade or use an alternative browser.
One Eyed Shark
Well-known member
- Messages
- 257
- Likes
- 13
In the last 6 days we have seen a double test of 580 and a double test of 590 both have failed
Not only that, the trendline of the highs since Jan 2000 currently sits at 10600, providing even stronger resistance to break through.
YM futures are already pointing to an open around 600.
This market does not need a lot to push it in one direction or the other, Michigan Consumer Sentiment is out at 2.45, if we do not see the break through 600 coupled with acceptable figures we could see a drop on the same scale as the last few days.
I am not calling the market one way or the other, but I am saying that the first 30 mins today needs some very tight stops.
One Eyed Shark
Well-known member
- Messages
- 257
- Likes
- 13
Agree with you Mom.
We have found some support on 10 min channel, and we have started to print some small H/L's and H/H's which at the very least suggests a pause, or could be a return to test higher levels.
Will now remain flat until 18.30-19.00. and see where we are then.
We have found some support on 10 min channel, and we have started to print some small H/L's and H/H's which at the very least suggests a pause, or could be a return to test higher levels.
Will now remain flat until 18.30-19.00. and see where we are then.
Had to reinstall software well back up & running again.
It looks like the Dow just can not break 10600 (well know I have said it you watch later Guaranteed to break it)
But it does look tired with all the great reports and GE, Home Depot & Intel, Johnson being upgraded I thought it might really push it through earlier.
It looks like the Dow just can not break 10600 (well know I have said it you watch later Guaranteed to break it)
But it does look tired with all the great reports and GE, Home Depot & Intel, Johnson being upgraded I thought it might really push it through earlier.
tradesmart
Experienced member
- Messages
- 1,286
- Likes
- 22
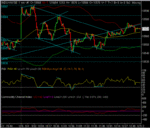
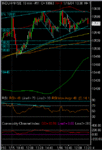
I thought that things looked a tad bearish for the Dow, but now looking bullish again and bouncing up off a rising 100ma (it really does seem to have magic properties!!)
The targets game seems to be working so far, with the little bear flag delivering its target of 10540, so if the current bull flag setup succeeds, we might be testing 10595 later….. 🙂
Long from 10550 with a breakeven stop (no dead certs in this game! 😕 )
The Nasdaq and the S&P are steaming, and they might well drag the Dow up…..
Attachments
tradesmart
Experienced member
- Messages
- 1,286
- Likes
- 22
Similar threads
- Replies
- 74
- Views
- 13K
- Replies
- 0
- Views
- 2K
- Replies
- 10
- Views
- 6K


