Dow 2010

If you are asking me where I think the DOW will go next, the answer is I do not care as I do not have to know.

For those of you that must continue to know, the Big M is slightly bearish until such time as a mole pops his head above the ground. Fail To Plan and Your Plan Will Fail. Wishful thinking is not planning.

Very interesting and all that........what you have to say. You are a little "cryptic" though to say the least......What does "The Expert" think to my 9 out of 9 trades correct so far in a row? Your opinion would be much appreciated.

.......Also do you know anything about reading "volume charts"?
 
Last edited:
DATE: Monday 22nd February 2010

DOW closed at 10,384 down 19 points.

Oil above $80 and energy sector weighs on the market in final minutes of a volatile session. Chevron tugs at Dow industrials as well. Also a little profit taking from the resent bull run I think.

What next......Who knows with the DOW.....I fancy a "Short" myself. I will see and decide later.


.....What do you think Chode. Any graphs to show us?
 
Last edited:
Very interesting and all that........what you have to say. You are a little "cryptic" though to say the least......What does "The Expert" think to my 9 out of 9 trades correct so far in a row? Your opinion would be much appreciated.

.......Also do you know anything about reading "volume charts"?

I read the newspaper now and again, but as most of it is just another person's opinion I tend to browse through it quickly picking out the factual information.

9 out of 9 is nothing to talk about unless they bank account balance is increasing substantially. It is much better to make 1 good trade than 10 mediocre ones.

you speak very philosphically and generalized. much of it we all have heard before. can u show/discuss entries, targets, stops, or anything specifically trading related. I hope I dont come across as being offensive, because that is not my intention.
 
well said, there is no good argument, just arguing :D
The Expert, we would very much appreciate if you would kind to share your views on the market like we all do here. We can all be wrong or right. sharing knowledge is the best thing we can do.

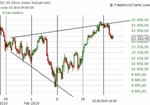
anyway... as expected the Dow dow started to fall after hitting a major resistance. Price formed a descending broadening wedge, a nice little flag on the breakout and continuing down.
 

Attachments

  • dow_2302.png
    dow_2302.png
    22.6 KB · Views: 218
I read the newspaper now and again, but as most of it is just another person's opinion I tend to browse through it quickly picking out the factual information.

9 out of 9 is nothing to talk about unless they bank account balance is increasing substantially. It is much better to make 1 good trade than 10 mediocre ones.

Went "Short" on the DOW and closed my position for a £178 profit. That is TEN out of TEN trades correct now.

"The Expert".....Sorry you view my last TEN out of TEN trades as mediocre........Total £4,130. I think it is better to go for smaller profits personally. It works for me.
 
Went "Short" on the DOW and closed my position for a £178 profit. That is TEN out of TEN trades correct now.

"The Expert".....Sorry you view my last TEN out of TEN trades as mediocre........Total £4,130. I think it is better to go for smaller profits personally. It works for me.

Can u tell what your system is based on? I can understand today the market going down because it was long overdue. From 9830 until 10400 that is almost 600 points in 2 weeks and even today the volume was very low with the down move signalling accumulation. In the last hour before closing there was significant buying and markets recovered only slightly but still it was almost close to 0.5%. Anyways I have been following this tread for a long time now first time commenting just curios to know what is your Holly Grail system what time period do u use on charts to trade.
 
well said, there is no good argument, just arguing :D
The Expert, we would very much appreciate if you would kind to share your views on the market like we all do here. We can all be wrong or right. sharing knowledge is the best thing we can do.

anyway... as expected the Dow dow started to fall after hitting a major resistance. Price formed a descending broadening wedge, a nice little flag on the breakout and continuing down.

Just be careful you do not get sucked into that Gann rubbish. If you draw enough lines on a chart, some of them are bound to be crossed over, sooner or later, and then, we get the "I was right" syndrome. Amateur trading at its best.
 
well after 5 years that amateur trading turned out to be quite profitable. I am using simple pattern trading method and they all have statistics to prove their reliability. I admit that i got carried away with those intraday movements because it does not go with my method , usually 60 min, daily and weekly charts work very well. that flag turned out to be a right angled and descending broadening formation and to be honest those short term charts are quite unreliable for me, they are posted only for discussion and speculation, what i trade is posted here on a daily and 60 min chart. If that trade would be to fail i loose nothing, not bad for me atleast.
You trade intraday and it works, good for you. I will stick what works for me.
 

Attachments

  • dow_2402.png
    dow_2402.png
    23.8 KB · Views: 186
  • dow_2402_1.png
    dow_2402_1.png
    24.2 KB · Views: 217
  • dow_2402_2.png
    dow_2402_2.png
    21.6 KB · Views: 193
Last edited:
Can u tell what your system is based on? I can understand today the market going down because it was long overdue. From 9830 until 10400 that is almost 600 points in 2 weeks and even today the volume was very low with the down move signalling accumulation. In the last hour before closing there was significant buying and markets recovered only slightly but still it was almost close to 0.5%. Anyways I have been following this tread for a long time now first time commenting just curios to know what is your Holly Grail system what time period do u use on charts to trade.

I have been studying stock market charts for about 8 years now.....I think. Most traders including "The Expert" would not agree with my method of making money in the stock market if they knew how I was doing it....I am an end of day trader and only spend about 30 mins looking at my charts. I use "Daily charts".....The stock market is made up of 4 main elements. Support and Resistance levels. Fear and Greed. How do you measure "Fear" and "Greed" in the stock market?......Well that is my secret weapon against the stock market that I am not sharing with anyone at this moment in time. I cannot give everything away as I am looking for investment in my system. I also use an array of technical indicators including the "Darvas box" but in a different way.

I also believe "Strongly" in Fibonacci (Phi or Golden number) which measures support and resistance levels.....(I bet "The Expert" hates that as much as Gann).....Have a good look at this brilliant website below. Fibonacci is in everything including DNA, life and the universe and the stock market. I really would advise any trader to take Fibonacci seriously and to look into it. Do not just dismiss it.....Please click on the links below:

http://goldennumber.net/dna.htm

http://goldennumber.net/stocks.htm

http://goldennumber.net/life.htm

Let me know what you think......anyone!
 
Last edited:
yes, the "golden ratio" very much applies to the stock market, it exist all over the universe
 
And, Mr Fibonacci spent most of his life trying to turn Lead into Gold, if you but care to read up on what you talk about.
 
yes, the "golden ratio" very much applies to the stock market, it exist all over the universe

So does matter, but very few know what matters most, and it is not anything like what you talk about.
 
Spcboe, I do not teach anyone, for every person must teach himself if he is to learn anything of real value. I like to think of myself as a converted idiot, as I know exactly how you all think, for I was once that soldier.

I now know why the Japs have so much respect for their elders, pity about their break pedals though.
 
The Expert, i respect you as a trader, but why do you disrespect our methods, while we prove that they work. We can also be quiet and go on with our trading but we like to share our views here, so should you.

anyway, that major resistance did its job and market is continuing to fall like expected :p, dow futures formed a H&S and broke the support just before the market opened
 

Attachments

  • dow1.gif
    dow1.gif
    20.9 KB · Views: 182
So does matter, but very few know what matters most, and it is not anything like what you talk about.

"What matters most"......."The Expert".....is that you start contributing something positive to this thread. Like telling us where you think the DOW will go next. We all have our own ideas about trading the DOW but we can all learn from each other.......so far your strange "Cryptic" use of words are falling on deaf ears. Start talking English.......By the way Fibonacci rules.
 
Last edited:
Dow is heading to 9750 for starters - in the next couple of weeks.

It will make a higher high but considerably higher than 6500 and then all our troubles will be behind us as it will go well past 15000 within about 2-5 years.

I should add that I am no expert. :cheesy:

Glad all you guys are keeping this thread going as I often read it with interest.
 
The Expert, i respect you as a trader, but why do you disrespect our methods, while we prove that they work. We can also be quiet and go on with our trading but we like to share our views here, so should you.

anyway, that major resistance did its job and market is continuing to fall like expected :p, dow futures formed a H&S and broke the support just before the market opened

I have no interest in your methods or calls, as I trade on my own with my own approach.

However, I do like to see people helping themselves improve as traders, and I will share my views in relation to trading so that they can have a choice.

I still say, and will always say, that regular TA is pure rubbish and is not the best way to trade for consistent profits. Do you honestly think that those in the know are going to make it public and dilute the pool, of course not, they will continue to manipulate and feed the rubbish to the suckers, for that is why we have markets in the first place.
 
This is just my opinion by the way.....but after studying the stock market for many years through Fibonacci and volume charts, I have come to the conclusion that the DOW has only got a limited life span. It started off at around "0" and I believe it will finish at "0" maybe within the next 10 years or so. Why do I say this. Over time we know the DOW always rises. Unfortunately this has produced great quantities of accumulative "Resistance Volume" or "buying volume" over the many years. I believe this "Resistance Volume" since the DOW started it's run (from the beginning) is so great now that it will not be able to support it's own weight. The DOW will be crushed by "Resistance Volume" in the end and Fibonacci rules.........

Also I think "Socionomics" is interesting. What is Socionomics? Socionomics teaches us that what "we" believe are causes are not causes at all but effects and what "we" think are effects are in fact causes. How many times have I seen the DOW move up on "bad news" and move down on "good news". I am beginning to think that "maybe" news or economic data does not move the DOW at all. I think what moves the DOW is just buying and selling volume within set limits of "Support" and "Resistance" levels (Fibonacci). Nothing else. It's all technical. I also believe that the graph that is being drawn by the DOW is only a clever illusion. What I am trying to say is that I don't think the DOW is random at all. It only looks random on a graph. There is evidence that collectively and as a group, humans think in Fibonacci when deciding on certain events. This also applies to the stock market and especially to the DOW.

What do you think my friends?
 
Last edited:
Top