The Expert
Established member
- Messages
- 618
- Likes
- 18
DATE: Friday 12th February 2010
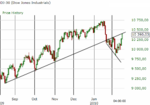
DOW closed at 10,098 down 46 points. At one point the DOW was down as low as 9,984 in early trading.
As I said in Post 53 I suspected the "tight trading corridor" yesterday was in fact "resistance volume". I also said "I have also noted that a sell order came in right at the end of the trading day according to my charts. This was obviously significant and that is why the DOW fell today.
What next short term? I am not sure to be honest as I have lost my volume charts at this moment in time. I am relying on freestockcharts.com.........It is indicating that there is room for a move up........Long term I believe we are going down......heavy!
Can you please expand on why a sell order at the end of the trading day will cause the DOW to fall the next trading day? Can you list the number of times this has happened on your chart?


