You are using an out of date browser. It may not display this or other websites correctly.
You should upgrade or use an alternative browser.
You should upgrade or use an alternative browser.
- Status
- Not open for further replies.
"This crisis is real and huge ................." 😈
Just something to bear in mind as we hover over 1000pts off the lows.... :cheesy:
today is the 10th trading day since the big houses rallied this mrkt on jan 23, they have to hold their position for a minimum of 10 days and can't trade the 1st hour after the open,so watch the reaction to the morning us numbers a half hour after they come out
today is the 10th trading day since the big houses rallied this mrkt on jan 23, they have to hold their position for a minimum of 10 days and can't trade the 1st hour after the open,so watch the reaction to the morning us numbers a half hour after they come out
Cheers Ammo
😆😆😆
catracho
Well-known member
- Messages
- 355
- Likes
- 34
Quick look at charts..
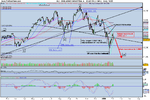
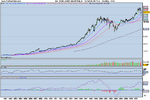
If we break below the flag/wedge formation on daily watch out below! On long term charts we have got a sell signal - 1st time since 2k -
Dow Theory sell signal still in force until we get new highs😱 in both industrials and transports
Long term European charts also don't bode well...short term - think we still need to test the Jan lows or lower..then see how mkts reacts...more rate cuts (not just US) may then mean a bottom in place for rest of year?
Attachments
Long Dow cash - 12285
One can assume that this trade is via a spreadbetting firm; where is your stop?
Yep. CMC.
Stop around 12200
That is a reasonable enough stop. Whilst I do not mean to teach you what you already know, it is better not to have stops at round figures (just thought it should be mentioned).
Yep. CMC.
Stop around 12200
Joining you here at 12266. (system trade)
Emergency stop quite a bit lower.
theroguetrader
Well-known member
- Messages
- 407
- Likes
- 36
DJI next week
the future shows a lo of 11,285 on 22 Jan,but its basically still in a downtrend - so it could go 100 lower... !!
BUT the nearest MA is starting to flatten, so it could - either go into a sideways range for a day or too and then " possibly " reverse back to the upside - (if the MA starts to curve more) -
best to wait until it trends ...... !!
Any views for next week ?
I think it is probably up overall
the future shows a lo of 11,285 on 22 Jan,but its basically still in a downtrend - so it could go 100 lower... !!
BUT the nearest MA is starting to flatten, so it could - either go into a sideways range for a day or too and then " possibly " reverse back to the upside - (if the MA starts to curve more) -
best to wait until it trends ...... !!
firewalker99
Legendary member
- Messages
- 6,655
- Likes
- 613
best to wait until it trends ...... !!
Well if you think it showed no trend today... I doubt it'll ever will.
Joining you here at 12266. (system trade)
Emergency stop quite a bit lower.
Closing half here at 12323 for 67 points.
Other half still running wIth stop at BE
Nice one Cat.....
4 now New Lows await I suspect .....700+ points to go.
Cb's seem frantic but powerless. People are now reluctantly starting to consider recession ............. so the possibility of a Depression can't be dismissed. This means Dow 10k at the min since Dot com collapse shed 4600pts over time ..and this seems much worse...... 😈
Still too much "optimism" ........... the penny hasn't dropped yet imo .....
If we break below the flag/wedge formation on daily watch out below! On long term charts we have got a sell signal - 1st time since 2k -
Dow Theory sell signal still in force until we get new highs😱 in both industrials and transports
Long term European charts also don't bode well...short term - think we still need to test the Jan lows or lower..then see how mkts reacts...more rate cuts (not just US) may then mean a bottom in place for rest of year?
4 now New Lows await I suspect .....700+ points to go.
Cb's seem frantic but powerless. People are now reluctantly starting to consider recession ............. so the possibility of a Depression can't be dismissed. This means Dow 10k at the min since Dot com collapse shed 4600pts over time ..and this seems much worse...... 😈
Still too much "optimism" ........... the penny hasn't dropped yet imo .....
Joining you here at 12266. (system trade)
Closing the other half of last nights trade here at 12338 for 72 points.
dans_ya_man
Active member
- Messages
- 184
- Likes
- 5
Closing the other half of last nights trade here at 12338 for 72 points.
Good trading Devilicus👍
I think we will be in a congestion zone for the next couple of days and 13000 being a very strong resistance level
Devilicus...the long you posted was basically the low tick of the day yesterday and so far I think your exit was around the high. Got any more crystal balls handy?
Im still holding my long 🙁 Should have closed some when you did.
Good luck everyone
Im still holding my long 🙁 Should have closed some when you did.
Good luck everyone
Long Dow cash - 12285
Getting out here at 12355 for 70 pips.
- Status
- Not open for further replies.
Similar threads
- Replies
- 9
- Views
- 3K


