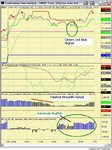
Nice blogs and charts everyone. Good to see the DOW thread kicking into life again.
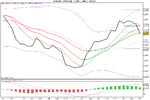
On the weekly charts we are bouncing up to the neckline of a possible larger H&S. However, indicators (MACD, Stochastics and RSI all showing overbought areas and turning bullish.
Charts say go long. Brain says what about the H&S.
Overall I'm thinking of sticking with the charts and leaving my brain out of this. Trade what you see and not what you think I believe the motto is... 🙄
Just switched to Candle Sticks and there is a really tall hanging man on the weekly charts which looks very bullish...
Didn't know tomorrow was employment day so may hold off a while but ideally looking to go long on weakness.
👍


