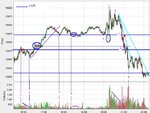
It was yesterday~~ Very important tip for me~~ I tried looking for that when we were at about 840 before the rate cut.... A very exciting day, my heart nearly jumped out....
I'm glad it didn't
😆 Seriously, be careful trading around news, I'm glad you made a decent profit but the market can be unforgiving the next time around...
Today was a particularly interesting day from a technical point of view, which I why I decided to post my analysis below. Hope someone gets something out of it.
___
We opened slightly below resistance around 12875. I took a short (red dot) because it looked like price rejected this area at "1".
Price moved sideways for the next 30 minutes on decreasing volume, but than at "2" it looked as if we were going to move down finally as volume came in. By the action that followed, it seemed as stopping volume though, so I had to exit my trade with a small loss. At the green dot I entered my second trade long, because price had now broken resistance and we should expect to see it move upwards towards the next level at 12920.
After the congestion around 16:30 a diagonal demandline can be drawn as price pauses before continuing upwards. Price breaks 12920 without much trouble and retraces back to test resistance now turned into support at "3" (volume peak). A bounce follows but price is unable to push above the previous swing high. "4" is another re-test, immediately followed by a very small trading range on flat volume. We should expect this to be a "time retracement" before another continuation, but just to be on the safe side we move our stop up to slightly below this, at 12910.
After 19:00 price goes higher again but is back at 12925 around 20:00. With 15 minutes to go it's likely that traders will want to position themselves before the FOMC. At "5" price spikes below just to 12900 and gets me out. Although minutes later it jumps up to 13000 on the news, I am left standing on the sidelines. But I am convinced it was the safest thing to do.
Volume takes off after the Fed and returns to somewhat normal levels, but fails to take out the highs at "6". Price turns lower now and at "7" it breaks back below the support at 12920. A new short entry is possible here, but I didn't take it because (a) I don't to open new positions so late in the day and (b) I don't trade breakouts but wait for retracement or swings to enter.
At "8" price dropped back to the next support level. There was also some potential support around 12890 from the congestion earlier in on the day. Price does pause there for a couple of minutes. When it continues on the way down, a first supply line can be drawn. The next target is around 12810.
The first signs of capitulation is the potential selling climax at "9" on high volume and the bar closes well off the lows close to support. However the bounce goes to 12850 and tries several times to get above but fails. When price falls back below 12820 a second supply line can be drawn and that remains unbroken till the end of the day, by which the trader who took a short position of 12920 could close out for a nice profit.

