Hi guys,
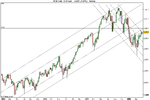
Looking at this first chart it's a 50/50 call. The long term uptrend here has clearly been broken imo.
However, the chart is at a cross point where imo previous support becomes resistance at 13000.
Will the DOW break above? or Will it continue in it's new down trend?
IMO we can't tell based on this TA chart. It's purely a 50/50 call.
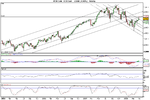
At times like this I think indicators are very valuable to confirm and verify price movement. Thus all of mine are indicating a rise. MACD, RSI, Stochastics, Pivot Points.
Price has also moved above moving average DEMA21 & DEMA34 and just shy of DEMA55.
So I reckon we still have some movement to the upside in the system. Pivot points R2 show 13052.
It's difficult for me to explain or argue further rises but in the absence of news and my inherent fundamental bias to the downside this is what TA is showing.
I have been watching the rise and scalping with shorts.
More small rises are a possibility but I'm still expecting a big long swing down. I'll change my opinion if we go well above 13000 and beyond.
Interesting times. Good trading everyone. :whistling