Dow 2007


Profit-Taking Negates Surprisingly Good Employment Report

Bob Carver
Sunday, January 07, 2007

Stocks tumbled on Friday despite a report from the government that 167,000 new jobs were created in December. This was a shock to the bond market, which had factored in a weakening economy based upon recent reports from Monster.com and ADP which showed job losses last month, and bond prices tumbled sharply, raising long term interest rates.

However, the reaction in the stock market was quite unexpected. Stocks tumbled on good news, something that calls into question the whole idea that news drives the markets. The financial journalists hastily went to work, flailing away at various and sundry excuses for stocks to sell off based upon this news. The first law of financial journalism is that news drives the markets, a convenient lie which supports the livelihood of journalists, obviously, but is a gross distortion of reality. In any case, they seemed to settle on the rationalization that a strong economy would forestall interest rate cuts by the Fed under the questionable assumption that the stock market's recent rally had been based upon the idea that this would be the next move by the Fed. Ignoring inconvenient facts is always a good strategy for journalists, who don't seem to realize that the prospect for future earnings is the overriding factor in determining stock prices, not interest rates, nor even their precious lifeblood, news. In fact, all of the journalists' explanations rang hollow, but that didn't stop the mantra they had settled upon. Basically, they missed the forest for the trees. Sometimes the truth is just too inconvenient to report.

The fact that almost all stock markets around the world fell -- many long before the US Employment Report was released -- apparently didn't factor into journalists' rationalizations. Many world commodity markets tumbled as well. The decline in markets last week can be attributed to one simple explanation which has nothing to do with news. That explanation is: profit-taking. Investors who had big gains in 2006 were simply selling their big winners. A look at what the major US stock indices did last week and last year shows that the largest losses occured in the big winners in 2006, a sign that this is a normal beginning of year exercise in profit-taking that has no longer term significance:

Stock Index 2006 Performance Last Week's Change
Dow Industrials +16.29% -0.29%
S&P 500 +13.62% -0.60%
NASDAQ-100 +6.76% +1.63%

Clearly, investors with large paper gains last year were anxious to cash in their chips in the biggest winners. Note that the only major index which showed a gain last week was the tech-heavy NASDAQ-100, which substantially lagged the others in 2006.

Albert Einsten once famously said, "Everything should be made as simple as possible, but no simpler." It's something that financial journalists should keep in mind if they want their product to retain whatever credibility it has left.
 
mr.marcus said:
"The National Income and Product Accounts for the third quarter incorporated an estimate by the Bureau of Economic Analysis (BEA) that gross output of new motor vehicles increased at a rapid pace in the third quarter, a sharp contrast to a drop in the IP index for motor vehicles (including parts production) for that same period. Much of that difference could be attributed to the BEA's method of in ferring motor vehicle output from separate data on sales, net international trade, and changes in inventories rather than measuring output directly using data on production. In addition, a large drop in the producer price index for light trucks in the third quarter resulted in a jump in the BEA's implied unit values of light trucks in inventory. In the staff's view, these measurement issues likely caused an overstatement of the rate of increase in real GDP in the third quarter, and the gradual unwinding of those effects would probably lead to an understatement of real GDP growth over the next several quarters".


... after years of trying to work out the markets,a very esteemed member,namely racer,has helped me to conclude that the only way to consistently trade,even intra-day scalping,is through the integration of leading economic reports with moving average crossovers confirmimg these findings.my aim for 2007 is , thru extensive research ,to devise a system,ma crossover based,to allow me to scalp for a target of 5 ticks on the dow,using a 10 pip stop.

i am also adding to this a very thorough investigation of jack herseys work,who is undoubtedly the master of price and volume analysis.other notable exponents of this craft also who should be studied include tom williams and our very own db phoenix.an example of jacks 30 year quest being,that large volume equals a consensus of opinion.ie all buyers etc and low volume ,a mix of buyers and sellers.another gem i have picked up from the master,is,volume controls the pace of price.i would advise anyone who doesn't know his work to wander over to ET.

a few other adjustments id like to share with you .i have concluded my main weakness was not having a trading plan.this is being rectified as we speak.it is quite possible a journal will follow.i also have realised that all this psychology stuff is garbage,dont listen to socrates,he is an old windbag.my new mantra is "just do it",even if i dont know what im doin.the pursuit of knowledge is very tiring.in fact i believe it can get in the way.in future im just gonna trust what the chart shows me.an up bar means an up market,simple isnt it.my main goal for this year is the focus of the $,goodbye knowledge ,its been nice,i have found my paradise,and its $$$$s.

I find the above report also extremely significant in my new path.i hope you do to.

thats it for 2007.i will be back with my findings in 2008.cheerio for now.wish me luck in my quest.cause its a large component of success i believe.we all need it.

Hi Marcus,

I have read your notes and can say I'm 100% in the same position. In fact over the xmas period I have been quite obsessive in reading and studying my past 2 years performance.
My losses have narrowed and I'm virtually about to brake even some months and make money in others.

My trading plan is

1. Money Management
2. Expectancy Ratio
3. Technical Analysis

Regarding points 1 and 2 it's quite possible to get 60% of the market direction wrong and still make money.

Using a 1 to 3 risk to reward ratio for example out of 100 trades

60 x lose £100 = £600 loss
40 x win £300 =£1200 win

Overall £600 win.

The psychology is important but only with respect to one self and discpline. ie Cutting losing positions early and letting winners run. This lesson learnt by me the hard way. This basic structure incorporates points 1 & 2 above.

Regarding trading system 3 and TA I agree the best system is MA for me.

a. I use fundamental analysis - economic news to gauge direction
b. Start from weekly charts and drill down to hourly using standard error channel to observe trend periods broken into best eye fit etc.
c. Depending on trading period ie weekly, daily or hourly intraday use
1. MA5 - 10 - 20 & 40 lines.
2. Looking at price to cross MAs
3. Looking for confirmations with MA crossovers too ie 5 x 10 & 10 x 20 etc.
4. Also observe brakeouts. ie braking a high or breaching a previous loss.
5. Under no circumstance to buy anything that is outside of the 40MA for the period. 20MA being the strongest indicator.
6. Use ADX - 25 line to confirm trends with the MAs. If below no trend hence extra caution.
7. Also coupled with the above use the normal indicators MACD, SlowStochastic & RSI to confirm timings.

I have been trying to use this system - systematically now for the last four months and can see the difference.

I also think reading to various opinions and ideas and contributions on this web site has helped me tremendously. I wish had discovered this site two years ago.

Wishing you and everybody else good luck and perhaps we can compare systems in due course.
:)
 
mr.marcus said:
yes surely its better to wait for the ball to show its path? and react.sure sometimes if you react too late the ball may smack you on the forehead,but thats only a few occasions right.
.

CORRECT "That's how I make money".
 
Monday view: Commodity crash flashes warning for world growth
Daily Telegraph
By Ambrose Evans-Pritchard: 08/01/2007

Somebody, somewhere, is using far less oil and copper then they were six months ago. Less wiring, less piping, and less plastic. Trucks are moving fewer goods. If demand is slipping for the two great staples of modern economics, it is hard to credit International Monetary Fund claims that blistering world growth near 5pc will carry on into 2007. Brent crude has crashed 11pc since New Year to $54.79 a barrel. It is down a third since May, despite an Opec cut of 1.2m barrels a day, falling output in non-Opec (Norway, Britain, America, and Mexico) and sabre-rattling by Iran. The slide matches the onset of the 1998 Asian crisis and the 2001 dotcom bust.

Copper – or "Dr Copper" to those calling it the best macro-forecaster in economics – is looking just as bruised. It crashed through resistance to $5,749 a tonne last week, a third below its peak in May. Stocks at LME warehouses have doubled since October to 230,000 tonnes. "People are saying it's all over as far as copper is concerned and clearly it is," said Jim Lennon, a strategist at Macquarie Bank. The broader CRB commodity index fell to a 20-month low last week, with a hair-raising technical chart.

Unless you believe that traders and commodity funds worth some $120bn now so dominate oil and copper that they trump day-to-day use in industry, homes, and transport, then the world economy is not as robust as it looks. Commodities are famously synchronised with the business cycle, peaking as growth peaks. They give us a barometric reading weeks before the data collected by bureaucrats. They never lie.

The culprits behind the mid-2006 commodity slide are well-known. Seventeen rate rises by the Federal Reserve squeezed credit. US property went over a cliff. By November, house starts had fallen 35pc from January. The average home gobbles up 439lb of copper. The annual rate of home equity withdrawal dropped to $350bn in late 2006 from $780bn a year earlier. Car sales skidded, falling below 17m for the first year since 1998. US economic growth cooled from 5.6pc in the Spring to 2pc by the third quarter.

Yet the icy draft had already blown through, or so we were told. Alan Greenspan, retired but ubiquitous, assured us recovery had begun. Investors took their cue, pushing the Dow index to fresh record of 12,630 by New Year – a bet that a fresh cycle of expansion is now under way. The May/June mini shake-out was deemed enough to purge the excesses of the long boom, clearing the way for a new boom. This happened in the "mid-cycle" correction of 1995 when Mr Greenspan piloted a soft-landing. The markets are betting that Ben Bernanke can pull off the same trick.

Of course, there had been no housing bubble in 1995. I remember because I then owned a Washington "brownstone" on Capitol Hill that kept losing money. Nor is it clear that Mr Bernanke himself shares such optimism. He warned a month ago that the glut of unsold homes may be worse than thought because official figures fail to pick up cancellations on house deals.

Yes, the Fed fretted about inflation at its latest meeting. It must. But recall the infamous minutes of November 2000 when the Greenspan team said the economy was growing nicely, and the biggest risk was "heightened inflation pressures". Within seven weeks, the Fed held an emergency session to slash rates by 0.5pc. The tech-bust was under way. Governor Edward Gramlich said later: "Everything was pointing up and, all of a sudden, everything started pointing down." Was everything really pointing up? Or did the Fed ignore the warnings of the bond markets because it was in thrall to a defective forecasting model? By then, the yield on 10-year Treasuries had been below three-month notes for seven months, a red alert. Today the yield curve has been inverted for six months.

This winter's oil and copper crash may prove to be a false alarm. Michael Lewis, commodity chief at Deutsche Bank, said crude would snap back on the first cold wind. "It's really a story about El Niño. There have been blasts of warmer air across the Northern Hemisphere for the last three months," he said. "The US economy may come off the rails at the end of 2007 but we think there is still enough liquidity for now, and we are very optimistic about Asia."

Robin Bhar, UBS metals analyst, said de-stocking by China's State Reserves Bureau had hammered copper over recent months, setting off speculative attacks by "black box traders" once the price fell through support. Funds now have the highest volume of "short" contracts since 2001. Demand will rebound because China still needs a quarter of global supply to feed its factories and electrify its new cities. Local output meets 50pc of use. "China's stockpiles are so low they are going to have start importing again," he said.

The "New Paradigm" of commodity bulls and market optimists is that the emerging powers are now rich and resilient enough to go it alone, whatever happens to America. The bloc's share of global GDP has jumped from 22pc to 28pc since the Asian crisis. They hold 72pc of the world's $4.5 trillion reserves. They alone account for the net rise in commodity use since 2004.

It is a highly compelling case. But would you bet the farm on it?
 
I get the feeling ...... Ambrose knows what he's talking about.
Apparently he's well connected..... at least that's what cyberspace says.
 
reckon a test of 12364 today - so had put in a short at premarket pump of 12404
stop 12435, limit 12366
 
karmit said:
reckon a test of 12364 today - so had put in a short at premarket pump of 12404
stop 12435, limit 12366


target hit. looks like its going down more.. but I'm happy with the pips today ;-)

wait and watch for now.
 
karmit said:
free fall soon?

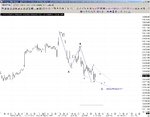
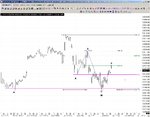
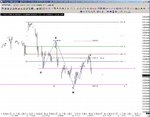
It feels like a messy ED pattern :rolleyes: (the labels are just to give a general idea as the wave iii might not be complete)

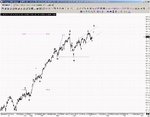
I did a quick doodle on MER as well seen as its had a few refs to it :eek:
 

Attachments

  • messy ed.jpg
    messy ed.jpg
    191.3 KB · Views: 241
  • MER.jpg
    MER.jpg
    220.4 KB · Views: 272
those 1:1 down on the blue lines (from previous posted chart) are now a better fit with the slighly lower low
now lets see what the fellas have to say about it
 
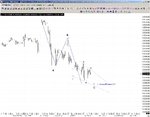
One last move down to complete the ED into the 1:1 :?:

Clear lines in the sand (wave ii level) if the bear count is incorrect ..the alt is a 1 ,2 i ii count of the lows :eek:
 

Attachments

  • messy ed2.jpg
    messy ed2.jpg
    194.8 KB · Views: 244
Last edited:
I've been slack with the INDU today... :eek:

With me trading stocks today I did the cardinal sin of not putting on the wave IV support (& the quiet accum vol @ the W IV on the YM give massive clues as well :eek:)....hence the bull count was the more obvious....
 

Attachments

  • slackbezzer.jpg
    slackbezzer.jpg
    210.7 KB · Views: 227
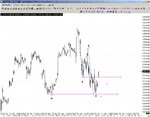
Key area for both sides the 12444 area...

I've put the bear count on as they still have the upper hand until the bulls take that level out...
 

Attachments

  • wxy.jpg
    wxy.jpg
    205.9 KB · Views: 228
mr.marcus said:
"The National Income and Product Accounts for the third quarter incorporated an estimate by the Bureau of Economic Analysis (BEA) that gross output of new motor vehicles increased at a rapid pace in the third quarter, a sharp contrast to a drop in the IP index for motor vehicles (including parts production) for that same period. Much of that difference could be attributed to the BEA's method of in ferring motor vehicle output from separate data on sales, net international trade, and changes in inventories rather than measuring output directly using data on production. In addition, a large drop in the producer price index for light trucks in the third quarter resulted in a jump in the BEA's implied unit values of light trucks in inventory. In the staff's view, these measurement issues likely caused an overstatement of the rate of increase in real GDP in the third quarter, and the gradual unwinding of those effects would probably lead to an understatement of real GDP growth over the next several quarters".


... after years of trying to work out the markets,a very esteemed member,namely racer,has helped me to conclude that the only way to consistently trade,even intra-day scalping,is through the integration of leading economic reports with moving average crossovers confirmimg these findings.my aim for 2007 is , thru extensive research ,to devise a system,ma crossover based,to allow me to scalp for a target of 5 ticks on the dow,using a 10 pip stop.

i am also adding to this a very thorough investigation of jack herseys work,who is undoubtedly the master of price and volume analysis.other notable exponents of this craft also who should be studied include tom williams and our very own db phoenix.an example of jacks 30 year quest being,that large volume equals a consensus of opinion.ie all buyers etc and low volume ,a mix of buyers and sellers.another gem i have picked up from the master,is,volume controls the pace of price.i would advise anyone who doesn't know his work to wander over to ET.

a few other adjustments id like to share with you .i have concluded my main weakness was not having a trading plan.this is being rectified as we speak.it is quite possible a journal will follow.i also have realised that all this psychology stuff is garbage,dont listen to socrates,he is an old windbag.my new mantra is "just do it",even if i dont know what im doin.the pursuit of knowledge is very tiring.in fact i believe it can get in the way.in future im just gonna trust what the chart shows me.an up bar means an up market,simple isnt it.my main goal for this year is the focus of the $,goodbye knowledge ,its been nice,i have found my paradise,and its $$$$s.

I find the above report also extremely significant in my new path.i hope you do to.

thats it for 2007.i will be back with my findings in 2008.cheerio for now.wish me luck in my quest.cause its a large component of success i believe.we all need it.

Now this is strange, for, I too was thinking along the exact lines, but , then, I just happened to meet my little friend the Leprechaun, whom, you all now know is called Luiden Mc Lu, and, he , has also now started up a VENDOR programme, called POT OF GOLD TRADING SERVICES.

I will see if he is willing to give away any more information, but he really is a stubborn little fellow :LOL:

Slainte,
 
If anyone has 60million euros to spare there is a nice castle in Transylvania for sale, once owned by none other than Dracula.....................aaaaaaaaaaaaaaaaaaaah
Could invite Socs or someone to stay too ? Plenty of room below somewhere I expect LOL
 
I believe I have first shout on that 'pile' as I have been recently recognised to be a good analogy for old Dracs ;)
 
Luiden has asked me, to tell ye, the following:

A Complex System is nothing more than a system with simple components but is subject to complex overall behaviour!

Distance is how far you can go, and Perspective is how far you can see!

He will say no more, sorry :eek:
 
I reckon the Dow is now showing signs of collapsing under it's own weight.

Friday jobs figs good = Dow Falls (would have normally rocketed)

Today oil tanks = Dow falls (would normally have rocketed)

Maybe a little premature (& I'm sure there'll be viscious spike ups), but a change in tone definitely.
 
Update on last nights post...

The bears did come out to play ;) :)
 

Attachments

  • bearsatplay.jpg
    bearsatplay.jpg
    215.4 KB · Views: 230
AAPL's fun at the moment as well :)

88 bucks to 85.25 in a few min's nice ... :eek:
 
Top