Well, in the case of Mr C "emotions are in and bears are out... and about"!
I don't trade the indices but instead review a small selection over the weekend as homework. 😆
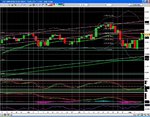
The charts I use are showing signs of momentum divergence and OBV divergence (highlighted in yellow)in the DJ30, S&P500 and Nas Comp.
The Dow shows a similar price pattern when you compare to the March waterfall (highlighted in light blue) to the latest waterfall. If this pattern plays out, I would envisage a hammer type formation with an intra day low of between 12966-13033 tommorow (6 Aug 2007). If not, it could be a bears picnic........ 😉
enjoy

