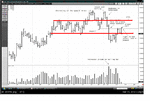
Discuss current Wyckoff charts

Hi Gary, just reading the above comments and just wanted to know if you think this is a contradiction (or i may have misunderstood your post). Are you saying you can not take signals off a 5 minute chart with reference to and hourly chart? Are you sure about this?

So from your comments you appear to not class scalping as trading?

Everything is relative to the time frame, scalping is just a definition of time. There for everything that happens in the markets has its own place and reason, and therefore its own importance/validity.

I find Wyckoff work very thought provoking by the way, and read your posts with interest. 👍


What I mean by scalping is short-term, intra-day trading, and the position liquidated during that same day.

Regarding the 5 minute chart, it will have it's own characteristics. So if you're watching a 5 minute bar chart, they will adhere to the principles of Wyckoff based on that time frame. In other words, if you buy beans on a 5 minute chart, you can't expect a 30 cent move during that day. If you buy beans based on an hourly time frame, you may be able to get a decent move, and possibly 30 cents. This is based on the Wyckoff principle of cause and effect. The longer the time frame, the more potential for a move. So a 60 minute bar chart has the potential to move more than a 5 minute bar chart.

In no way was I inferring that scalping is not trading. Sorry for the confusion. It is trading obviously, but the smallest of time frames tend to be more erratic and noise and news driven than the larger time frames. Inherently, you can get more "chopped up" using those time frames.

Gary
 
ES daily and 15 minute charts and bond 60 minute chart

20120306a.png

20120306b.png

20120306c.png
 
Hi Gary, so from this Wykoff based viewpoint of information what are you expecting for the next 2 days in the ES?

If we cannot see future trades based on this information it has little use to a trader.

So from a Wykoff POV what typically happens after we have had this sort of top in the ES?

It will be interesting to compare the actual result to the typical action based on 60+ years of Wykoff theory.

Thank you.


As you probably know, in Wyckoff, we use only price, action, and volume to determine market behavior. So if we're in an uptrend, and there is no supply that comes into the market, I would expect higher prices. Of course, it is always possible to get supply in the market at any point. But based upon the information today, we would have to expect higher prices. We never know exactly market behavior, but we use to price and volume tools to give us an edge. That's all one can ever do.


Gary
 
gary

it all looks so nice and reasonably obvious when you present the pictures, but i've never been able to cut it when these things are developing in real time - by the time i can make sense (sic) of what's happening it's generally too late.
 
gary

it all looks so nice and reasonably obvious when you present the pictures, but i've never been able to cut it when these things are developing in real time - by the time i can make sense (sic) of what's happening it's generally too late.

The areas of support and resistance in a trading range are many times fairly obvious. If you prepare for the areas to be retested and trade with the trend of the market, the decision process is fairly simple. There's always going to be a hesitancy to actually make the trade. So it is best to try to eliminate as much emotion as you can and trust your tools. For example, if you look at daily April Cattle, there was a perfect retest the last two days of resistance at the 128 area. See attached chart as an example.

20120315e.png
 
gary

not quite sure where you are suggesting the sell since I wouldn't know it was a low volume re-test until the bar had closed. i'd also be a bit confused since I guess I might have drawn in a trading range somewhere like the red lines and been in a bit of a quandary as to where I might assume support and therefore a re-test of it.
 

Attachments

  • cattle(1).GIF
    cattle(1).GIF
    43.5 KB · Views: 642
Ok, so if we assume you take the short signal at the close (as you have to, due to the need to see the volume attached) so that is an entry at just below 12700. You have posted "stop" at 12900 on your chart; is this for this trade? If so what is the target here?

To be honest I would be very weary of that low volume re-test of 128 in this area. It maybe good for a day or so, but I would think this market is most likely to squeeze up from here and take out the highs on your chart.

If you could give some feedback in regards to this current short, that would be good.

Thanks
 
gary

not quite sure where you are suggesting the sell since I wouldn't know it was a low volume re-test until the bar had closed. i'd also be a bit confused since I guess I might have drawn in a trading range somewhere like the red lines and been in a bit of a quandary as to where I might assume support and therefore a re-test of it.


I tried to draw lines that tell me a story of strength and weakness. Since the initial high, the low of the retest was at the 128 area. This caused the reaction back to near the highs. So once this 128 area was taken out with a large bar and increased volume, I consider that area of supply overtaking demand. So a retest of that area is called a retest of broken ice, which sets up a low risk sell with a stop above the vertical supply bar above 12872. The 128 area, being the reaction low, before a retest of the high, once broken with supply, then makes the chart have a lower low and a lower high, thus making it a proper sell. As you can see, the chart had a large break even after the chart was posted earlier today.

Gary
 
Ok, so if we assume you take the short signal at the close (as you have to, due to the need to see the volume attached) so that is an entry at just below 12700. You have posted "stop" at 12900 on your chart; is this for this trade? If so what is the target here?

To be honest I would be very weary of that low volume re-test of 128 in this area. It maybe good for a day or so, but I would think this market is most likely to squeeze up from here and take out the highs on your chart.

If you could give some feedback in regards to this current short, that would be good.

Thanks


Since I have a supply bar on the daily chart on March 6th, on a retest to resistance, in that area, allows me to make a proper short trade at the 128 area with a stop above that vertical supply bar of March 6th. The high of that bar was 12872.5. If that area is taken out, then it is possible that demand has re-established itself. I would probably want to be out of the market. As you can see today, that trade was worth over $1,000. I would be looking for the 12515 area to be tested, and if that's broken, 12415 area.

Gary
 
Thanks Gary. What I was trying to find out was with regards to the entry. Do you use discretion here? As to short the test at 12800 would mean the bar would still be developing, thus there would be no way of knowing what the completed volume would be at this point.

Therefore, entries are not on bar close? Obviously this makes a big difference to the risk/reward. I think this was a point Barjon may have been getting at with his comment about being late in a trade.

Thanks again.


Several days ago I sent out a recommendation to sell at 127975 as the market was trading at the 12720 area. When I see supply in the background, I want to sell a retest of that supply if the behavior to the area is what I consider weak. So the trade was presented in foresight and the stop was easily defined above that vertical supply bar at the 12872 area. If we got a retest to the 128 area on increasing volume and good bar length, I may have second guesses about taking the trade. Or, if the market does not react down from the 128 area, this may be considered absorption and I would simply liquidate my trade before the stop was hit. My area of risk was always defined but it would depend on market behavior how I would handle the trade. If I do not have weakness in the background, I would not have suggested the trade, but since there was weakness, it set up a low risk, high probability trade risk, as the risk to reward can be clearly defined. If I sell the market after today's daily bar close, I am approximately $1000 away from my edge at the 128 area. Though the market is weaker by today's break, my risk increases because I'm not trading at an edge. I know that one of the hardest things to do is to sell a market when the market is rallying. But this is essentially what strong hands do in the process of transference of risk.

Regarding volume, you can see intraday volume and determine if that volume is lighter or heavier than recent action. Since most markets are electronic, the volume is current. The daily volume of course won't be finished until the end of the day, but you can see the process of the volume coming in or not coming in intraday.

Gary
 
Thanks Gary. What I was trying to find out was with regards to the entry. Do you use discretion here? As to short the test at 12800 would mean the bar would still be developing, thus there would be no way of knowing what the completed volume would be at this point.

Therefore, entries are not on bar close? Obviously this makes a big difference to the risk/reward. I think this was a point Barjon may have been getting at with his comment about being late in a trade.

Thanks again.

true, i was
 
Several days ago I sent out a recommendation to sell at 127975 as the market was trading at the 12720 area. When I see supply in the background, I want to sell a retest of that supply if the behavior to the area is what I consider weak. So the trade was presented in foresight and the stop was easily defined above that vertical supply bar at the 12872 area. If we got a retest to the 128 area on increasing volume and good bar length, I may have second guesses about taking the trade. Or, if the market does not react down from the 128 area, this may be considered absorption and I would simply liquidate my trade before the stop was hit. My area of risk was always defined but it would depend on market behavior how I would handle the trade. If I do not have weakness in the background, I would not have suggested the trade, but since there was weakness, it set up a low risk, high probability trade risk, as the risk to reward can be clearly defined. If I sell the market after today's daily bar close, I am approximately $1000 away from my edge at the 128 area. Though the market is weaker by today's break, my risk increases because I'm not trading at an edge. I know that one of the hardest things to do is to sell a market when the market is rallying. But this is essentially what strong hands do in the process of transference of risk.

Regarding volume, you can see intraday volume and determine if that volume is lighter or heavier than recent action. Since most markets are electronic, the volume is current. The daily volume of course won't be finished until the end of the day, but you can see the process of the volume coming in or not coming in intraday.

Gary

Ok I see where you are coming from. This is what I was asking a while back, about how you actually use this in real time. You have an understanding of the dynamics and so are positioned to be on the right side of the market when the trade sets up.

Good trading!

Any chance of an update of today's action with the volume. Maybe a 30 min chart as well?

Thanks

Here you go! Please let me know if you have any questions.

20120315f.png
 
Last edited:
Back
Top