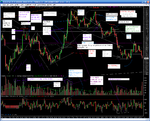
Here's a godawful mess of hindsight which will probably help nobody but at least shows some of things I was looking at today re price action. For what it's worth LOL. Chart is 2 minute Dow futures, which Hung will shortly be trading
🙂 ... the 1 pip spread will be a breath of fresh air after SB I promise. And no more confusion in watching cash Dow (slow) and trying to trade futures price (fast). The indicator at the bottom is NYSE Tick. Bear in mind I'm looking at a lot of other stuff as well such as other timeframes, ES, NQ, market breadth, the occasional Fib, pivots, time of day, divergence from vwap, channels, volume, time & sales etc. The 50 ma was an old stalwart of chartman's, equivalent to 100 on a 1 min or 20 on a 5 min ... still a handy line in the sand and a bit of a magnet too.
For definition of 123 and Ross Hook (& the Trader's Trick Entry I and many others use) look
in the Traderpedia.
http://www.trade2win.com/traderpedia/Ross_Hook
http://www.trade2win.com/traderpedia/1-2-3_formation
Just one way out of many to add some systematic parameters to one's trade entries - I'm not recommending it as a particularly wonderful method but it can help discipline and help one study price with a little helpful structure.
Trading price may seem odd at first but it gets easier. Try and understand what it means when price is moving very fast and when it isn't, what the pros are trying to achieve, when they are active and why, the difference between clean and choppy wave structure, taste the fear, greed, perceptions of value & expectation in the bars as they print, learn to spot the program trades and see the bait dangled by the pros, check the mass of mechanical systems coming in at bar closes and those trying to feed off them just previous ... that sort of thing. Eek.
😱 But as rols says below if you watch the blighters printing for long enough the subconscious learns stuff and judging the mood and likely direction given x or y becomes a bit easier. One seemingly perverse thing I used to do given that I always bought or sold at the wrong moment was work out where my stop was going to be for that trade and then enter there instead. The rationale being that the market will do its best to wrong-foot you and where you are likely to throw in the towel after a bad entry can be quite predictable to the experienced and they're the ones taking advantage, often doing the opposite to you at your stop, so why not try and do the same. Not literally and every time of course, but possibly something to explore.
These threads may be handy too:
http://www.trade2win.com/boards/showthread.php?t=7751
http://www.trade2win.com/boards/showthread.php?t=13451
Also check out posts by sandpiper, mrmarcus, china white, chartman, skimbleshanks, a320, Joules_MM1, dbphoenix to name but a few.
PS Exits? Usually fixed targets for first 2/3 - e.g 1/3 @ 6; 1/3 @12; then last 1/3 discretionary trail. Depends on the prints, sometimes pull out when in doubt e.g at a nasty candle (e.g the one in yellow ellipse marked demand test after warnings from tick/volume/previous candles), obvious technical target (1:1, 138/161% extension, higher TF s/r etc.). Will vary size according to perception of conditions. I am impatient and generate too much commission while missing too many points. Much to improve.
All vague I know, sorry, and anyone can mark up a chart after the event and pick out stuff that seemed to have worked. But at least I do trade this stuff albeit clumsily.

