Diary of a swing spread better

No worries dude - no hurry... I'm thinkin of starting to use the strategy again, I've done a bit in the last few weeks, but not with a massive amount of success so any tips would be warmly received.
Also, one other question, when do you trade the strategy, do you get a chance to trade this at work or do you wait for the after lunch session?
 
chindl said:
No worries dude - no hurry... I'm thinkin of starting to use the strategy again, I've done a bit in the last few weeks, but not with a massive amount of success so any tips would be warmly received.
Also, one other question, when do you trade the strategy, do you get a chance to trade this at work or do you wait for the after lunch session?

Hi Chris,

I'm quite lucky in that I can trade from work. We have an unfiltered ADSL line for technical purposes due to the restrictions of the company proxy/firewall. This is reason why I can trade the DAX in the morning and pick up the Early session from the Dow.

I've just started using SierraChart for my TA and as a result haven't traded much over the last couple of days. I did manage to scalp 25 points today but I'm not very happy with myself as the trades were not based on my strategy and quite risky. For some strange reason I've been looking for bounces off the lows, very risky indeed. I used to trade like this a couple of years ago. Sometimes I find the market too hard to resist :devilish:
 
chindl said:
Slaps - I note you wait for a 20 point break of the 100 EMA in whichever direction rather than trade on the pullback to the 100EMA, as Chartman's article suggests. Do you find this to be protective to you and that you trade less and profit more by waiting for that confirmation? When I looked at your charts posted on Sunday, I couldn't help noticing that entry 1, for me, would have been on the pullback rather than the 20 point break to the downside. However, I do appreciate that this could result in overtrading when taking each pullback to the EMA following the break and could therefore increase the losses, but of course, stops would potentially be ten or so points closer.


Ideally I try to wait for a confirmation after a pull back but they don't always develop cleanly. The main purpose with the system as I understand from the old threads is to try and pick up the longer moves. In a ranging market this can be tricky especially when the range is hovering around the 100ema. I also monitor the 5,10 min charts are the day progesses. For instance on the 5 min chart today we've just hit the 100ema from below but not breached it, do I go short? No. It's too close to the close. Some braver souls may though ;)

Cheers
 
Slapshot said:
Hi Chris,

I'm quite lucky in that I can trade from work. We have an unfiltered ADSL line for technical purposes due to the restrictions of the company proxy/firewall.

There is also software available which enables you to connect to your home PC via a web browser over a secure connection. PM me if you want some details

Cheers
 
Slapshot said:
For instance on the 5 min chart today we've just hit the 100ema from below but not breached it, do I go short? No. It's too close to the close. Some braver souls may though ;)

:rolleyes: Typical!! Up to the 100ema (10800) and straight back down to 10700!!!
 
The loss I had with NG I got back with a quick short with BAY. I had a look at the FT100 stocks and BAY was about the only one showing a small rise, which I thought would not continue.

Split
 
OK Slaps - here's some charts. Good day for me, even though I missed approximately 100 points with early exits and missed opps due to kiddy bed time, I still came away with no losers and 72 points to the good. Now given I have only traded the 100 ema system a couple a times in two years I am more than chuffed. Lots on offer today with Chartmans strategy, so here come the charts. I even missed an opportunity on my way home from work, but caught another as soon as I got in. Check these out and let me have comments. Exits need more work, confidence may not be there in the system yet, but I can feel it in me bones man.
And yes, I saw that top in the last hlf hr or so, gave us a pincer on the candles and then a tower to confirm the top. Candles even work on one min charts hey!?!
Well interested in gettin through the proxy BTW - will PM you my e-mail add.

For those end of dayers. I'll be looking first thing and will try and post something post PPI and pre CPI tomorrow. Very very negative day for stocks in the end I feel, even if not massively down, but I need to analyse and CPI tomorrow could change things somewhat, which is why I feel the market did not bomb completely today. A negative CPI and we could see serious downside from here. Hope you all had a good day.
Chris
 

Attachments

  • 13 June.doc
    90.5 KB · Views: 227
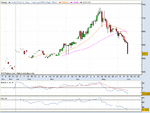
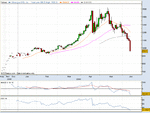
BTW - currencies are still on the slide, but check out metals, massive massive sell offs in the last week or two, and this includes copper. Gold alone has lost over $100, or 1000 points since the 31 May, that is some sell off. Today, it lost $44, or 448 points and it has virtually turned the trend from up to down. The warning was there though, the trend in silver seemed to turn south on Friday, and that always leads Gold. Incidentally, silver lost 12% today, phew. Maybe we do have a top in the metals after all, which is good for equities. I've posted a couple of charts. Look at the volatility in Silver during April early May, this type of volatility can signify a top. Now you should all look back at the indices charts for recent periods, is that the same? A good $30 range in Silver then major sell off, follwed by a gold rush by the bears.Nymex was also a big seller today, with Crude down $2+ as well..
BTW - don't Brazil look bobbins?? Worst team of the cup so far!!
Good night all.
Chris
 

Attachments

  • Gold.gif
    Gold.gif
    17.1 KB · Views: 143
  • Silver.gif
    Silver.gif
    18.4 KB · Views: 133
Hi guys,

The more I use my pivot points the more i want to daytrade them :cheesy:

I went short yesterday at the close with a 50pt stop which was hit just before 3pm. I got home about 6:30 and cheekily switched on for a peep, i then decided to place a second short at yesterdays close, thats gone my way by 100 pts so 50 pts up for the day.

Still strugling with myself as to how i should trade, i know i can take advantage of more opportunities daytrading but only if i keep up the discipline. (decisions, decisions)

Anyway the chart below includes todays pivot points, the lines i've added in are the weekly pivot points.
 

Attachments

  • US30.png
    US30.png
    12 KB · Views: 137
chindl said:
BTW - currencies are still on the slide, but check out metals, massive massive sell offs in the last week or two, and this includes copper. Gold alone has lost over $100, or 1000 points since the 31 May, that is some sell off. Today, it lost $44, or 448 points and it has virtually turned the trend from up to down. The warning was there though, the trend in silver seemed to turn south on Friday, and that always leads Gold. Incidentally, silver lost 12% today, phew. Maybe we do have a top in the metals after all, which is good for equities. I've posted a couple of charts. Look at the volatility in Silver during April early May, this type of volatility can signify a top. Now you should all look back at the indices charts for recent periods, is that the same? A good $30 range in Silver then major sell off, follwed by a gold rush by the bears.Nymex was also a big seller today, with Crude down $2+ as well..
BTW - don't Brazil look bobbins?? Worst team of the cup so far!!
Good night all.
Chris

Great post as usual, Chris! Are you actually trading metals as well and how? Sorry for this innocent question :) I am thinking of moving to other markets as the DOW does not suit me timewise at the moment.

And I felt so sorry for the Croatian. A 1-1 draw would have been fairer to them.

Thanks a lot,

Hung
 
And you guys have all made money today (well, yesterday now), well done! I'll look at the chart to see how Marc Rivalland's method would fare and see if I can convince you to use it from time to time.
 
I normally don't trade the 30-45 min. The first short signal was given at around 15:10 and profit taking signal was given at around 15:20, earning around 40 points.
 

Attachments

  • dow 1.jpg
    dow 1.jpg
    160 KB · Views: 101
The second short signal was a failed one and would have been stopped out at a loss of 10 points.

But the next signal, just a minute after would yield another 40 points when profit was to be taken where the green circle is.

The sum so far is a win of 70 points (spreads not included).
 

Attachments

  • dow 2.jpg
    dow 2.jpg
    162.7 KB · Views: 114
The next short trade would have been stopped out at a loss of 10 points and the trend changed from down to up.

A buy signal was given at 16:23.
 

Attachments

  • dow 3.jpg
    dow 3.jpg
    152.3 KB · Views: 110
The maximum profit for this long was 60 points but I would have taken just 20 making 'earning' so far stand at 80 points. The rule is to take profit when price has pierced the BB for three bars by the way.
 

Attachments

  • dow 4.jpg
    dow 4.jpg
    137.5 KB · Views: 133
Then the trend changed to down at 17:15ish and my next short would have been stopped out. Another 10 point loss.

And then I realise I should go to bed :)

Good trading everyone,

H
 
hungvir said:
Great post as usual, Chris! Are you actually trading metals as well and how? Sorry for this innocent question :) I am thinking of moving to other markets as the DOW does not suit me timewise at the moment.

Thanks a lot,

Hung

Yes - I trade a certain number of futures markets on a position trading basis using EOD. However, the volatility is such at the moment that I have not been positioned since I closed out trades at the start of last week. Have been tempted by the three indices, but, due to the reports this week, have decided to stand aside. I'm looking at value on the currencies at the moment, the trend in the Euro is still strong to the upside and it is now bouncing around the 49 SMA. The fast MACD line is now showing an oversold status, and is now looking to turn north, although the slower MACD line is still trending down. I will probably wait and see if the fast line changes direction before the trend is extinguished. If so, I will probably go long on the next higher candle close. The Yen is also showing the same sort of status, although it was weaker yesterday and this surprised me, as technically it looked stronger than european currencies yesterday.
See your PM also.
Chris
 

Attachments

  • Euro 13 June.doc
    64.5 KB · Views: 159
Elefteros said:
Hi guys,

The more I use my pivot points the more i want to daytrade them :cheesy:

I went short yesterday at the close with a 50pt stop which was hit just before 3pm. I got home about 6:30 and cheekily switched on for a peep, i then decided to place a second short at yesterdays close, thats gone my way by 100 pts so 50 pts up for the day.

Still strugling with myself as to how i should trade, i know i can take advantage of more opportunities daytrading but only if i keep up the discipline. (decisions, decisions)

Anyway the chart below includes todays pivot points, the lines i've added in are the weekly pivot points.
My two penneth, stick with a winning strategy for now. If you are consistently winning don't break that habit by tip toeing into day trading. Paper trade it if you like, make sure the plan you put in place to day trade works.
All day trades I take on are deemed fun trades, the real deal is the EOD, that is where my money is made.
Best of luck whatever you decide.
Chris
 
chindl said:
Yes - I trade a certain number of futures markets on a position trading basis using EOD. However, the volatility is such at the moment that I have not been positioned since I closed out trades at the start of last week. Have been tempted by the three indices, but, due to the reports this week, have decided to stand aside. I'm looking at value on the currencies at the moment, the trend in the Euro is still strong to the upside and it is now bouncing around the 49 SMA. The fast MACD line is now showing an oversold status, and is now looking to turn north, although the slower MACD line is still trending down. I will probably wait and see if the fast line changes direction before the trend is extinguished. If so, I will probably go long on the next higher candle close. The Yen is also showing the same sort of status, although it was weaker yesterday and this surprised me, as technically it looked stronger than european currencies yesterday.
See your PM also.
Chris

Many thanks, Chris!

The Euro chart looks quite bearish to me with two recent failed attempts to make new highs. I am quite intrigued that you'll go long next. Would shorting the next pullback be something that you may consider?!

Cheers,

Hung
 
Top