Lightning McQueen
Moderator
- Messages
- 5,029
- Likes
- 841
hungvir said:Thank you, Don.
I am so glad that I've met some lovely people here. Marc Rivalland's book is one of the best trading books in my opinion. The only missing thing in the book is what to do in a trading range.
By the way, I quite like the green/red signal on one of the charts you posted here. Would you mind explaining what it is and how it can help you with making decisions.
Thanks a lot,
Hung
Good morning hung
On the whole the members here are quite a friendly helpful bunch aren't they AND this thread hasn't been highjacked yet 😀
Have not bought the book yet but will look on ebay see if is cheap there (I do like a bargain) :cheesy:
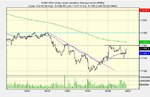
My thoughts on trading ranges would be if they are wide enough (as in the dow) you could swing trade the price moves. Narrow ranges stay out of the market, after all doing nothing in this case is a position isn't it, ie no swings to trade.
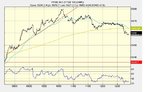
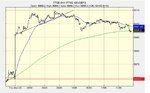
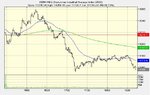
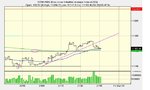
The idea behind the red/green signal is to able to instantly visually see the market swings and as the bars change colour trade the signal I would just trade the signal and not watch the upper price bar chart at all while trading yes thats right the idea is to do away with price and volume altogether while trading. Google that you wont find much!
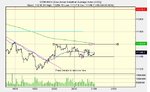
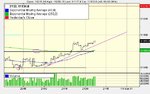
The whole thing is being forward tested soon on capital spreads simulator it backtested really well and showed a nice upward slope. A first for one of my strategies 😱
I dont actually trade the red/green ones they are the alert the red/blue bars are the trade trigger but its not perfect at the moment as you would expect, but the same setting works quite well on on most time frames from 10 mins to daily. under 10 mins too much noise, haven't tried weekly or monthly yet as I would like to trade shorter time frames.
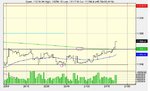
the red/green indicator is the bill williams ac oscillator (off ebay)
the red/blue indicator is in TS already i just changed it and put in some extra code to create what i wanted
Have a good day
Don
🙂