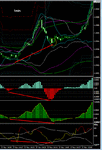
Comprehensive Trading System/Methodology

bbmac. how do we know where the sbr/rbs zone on such a noisy/trendless chart.?

Hi, the supp/res/sbr/rbs zones on the trend t/f chart will exist whether the lower intermediate and trigger t/f's are ranging or trending, like early fri session in gbpusd, it was very much a market for the lower t/f's as price consolidated, the intermediate (5min) providing the potential supp/res/sbr/rbs areas for trigger t/f (imin) set-ups until price began to move a bit and the pitential supp/res/sbr/rbs zones on tbhe trend t/f begain to be challenged.

In ranging conditions, don'e forget the potential supp/res areas as well of course as the potential sbr/rbs areas.
 
M17th Nov 08; Early £ recovery in london/europe after a 4778-4646 asian range. No Re-entry set-ups in steep upmove to 5/30min uptrend, bar the retrace to 4900/4890 area, the 1206pm set-up decsribed below....no with trend follow thru as yet from that set-up but has seen +30pips.

The daily chart gave the clue as to possible market direction today with a Bullish Rev C set-up.

0823am Rev Extr (whole reversal candle closes outside 20bol,) no 5min main chart supporting set-up, 1/5min small charts confirm @ pot res = u/side of breeched 1hr ascending supp t/line, prev 1hr minor sw lo zone, ...saw +30+
0901am Rev C, no 5min main chart supporting set-up, 1/5min small charts confirm @ pot rbs/supp = not identified...saw +30+
[ie 1min Reversal in 5min range.]
1000am Rev Extr, no 5min main chart supporting set-up (developing Rev Extr) 1/5min small charts confirm @ pot res = 1hr desc res t/line,...saw +15
1013am Rev Aii, 5min Rev Extr, 1/5min small charts confirm @ pot res = 76.4% 4957-4656, offers (mni,) Dly FRZ2,..saw +8 best.
1036am Rev B, 5min Rev Extr, 1/5/15min small charts confirm @ pot res = 4950/60 offers (mni) Dly FRZ2, area of fri Hi....saw +30
1128am Rev A, 5min Rev B @ pot res = as 1036am - 2nd test,...saw +30+
1206pm Rev Extr, 5min Re-ent 2, 1min small chart confirms @ pot rbs = bids now 4900/4890 (mni), 23.6% 4656- currremt i/day hi, ..saw +30

G/L.
 
This Trading System or more aptly described...Methodology ...accurately identifies potential support/resistance/sbr/rbs in the market then identifies both with trend and against trend set-ups via easily recognisable tech indicator patterns, confirmed by individual price action itself, as the trigger for entry.

The system/methodology utilises the triple screen approach favoured by Alexander Elder and although I choose to utilise it on the lower time frames to capture scalp/small intraday moves it can be used on any sensible combination of time frames such as 1hr (trigger), 4hr (intermediate) and Daily (longer time frame) for example, for longer 'position' trades. Effectively the system/methodology identifies high probability Reversal/Pullback and With trend trading opportunities after a pullback.

What I should also tell you is that any Trading System or Methodology derived from any third party, should really become a template for you to take the bits that you want and develop your own 'trading edge' that suits your particular tolerances/preferences/style that are unique to you. This system/methodology encompasses the essentials of technical trading, ie support/resistance, trend, and price action, indicating too how to use technical indicators to fine tune your entry.

I should also tell you that although the System/Methodology identifies high probability trading opportunities, ie the 'trading edge,' ...remember, as Mark Douglas (Trading in the Zone, The Disciplined Trader etc...) correctly states ,...the trading edge is the simple part, ...Psychology is 80%+ of trading, and I fully concur with this.

As a trader of some longevity now the Trading System/Methodology doesn't ever let me down, but I have let it down. There have been times when I didn't take a signal or came out of a trade too early, or bottled out at smaller volume traded than I should have done etc etc....In other words I had not mastered the psychological aspects at play in my own trading.

In the perfect world, a trading edge should be executed with impunity,...when the trading edge sets-up, you should trade it, no if's but's or maybe's, None of us knows what will happen once we have entered the market. Trading is simply about probabilities, ......All we know is that we have a trading edge (s) that over a historical sample of set-ups produced an overall net gain, so that when it next sets-up we know that there is a greater probability of something happening than another. The Distribution of winning and losing set-ups of a trading edge over any given sample is not known to us in advance, how can it be,? so all we can do is execute a market entry when we identify our trading edge and leave the rest to the laws of probability.

Mastering the psychology at play as a trader is the most difficult task we face, and in this respect, I am always learning. There have been times for me when Fear or Greed has taken hold, to say nothing of their cousins, Hope and Revenge....and exacted their damaging effects, meanwhile the trading edge continues to present itself, willing me to treat it correctly.
 
Last edited:
  • Like
Reactions: BSD
GBPusd 5min congestion off the then intraday highs breaks to the upside, see-ing 4 more decent set-ups in this Trading System/Methodology.

The 1445pm Re-entry to trend set-up screenshot is attached below.
[notice how the previous 5min (intermediate) sw hi zone, ie potential rbs gave support after the pukllback at the trigger set-up (1min.)

** 1430pm U.s data NY Empire manuf **
1436pm Rev Extr, 5min Rev Aii seq, 1/5/15min small charts confirm with 5min fib channel [asc] breech @ pot res = offers, prev 1h4/4hr sw hi zone,...saw +30+
1445pm Re-ent 2 (into 5/30min uptrend, 5/30min macd hists + above axis) @ pot rbs = prev 5min sw hi zone...saw +30+
1514pm Rev Extr, 5min rev A seq, other conditions as 1436pm, @ pot res = 23.6% 7516-4557...rejected upcoming data....saw +15+ at time of writing
** 1515pm U.s data ind prod & Capac util **
1524pm Rev B , 5min Rev A seq, other conditions as 1514pm - 2nd test of that potential res...saw +30+ at time of writing.

G/L.
 

Attachments

  • 1min Re-entry 2.gif
    1min Re-entry 2.gif
    25.6 KB · Views: 265
Barring any speific questions/advice, I will now stop posting regularly to this thread. All the information needed to trade this System/Methodology is contained herein and any further posts from me on the subject, excepting the above, would be repetition.

G/L.
 
In reply to an email, the price action today in gbpusd illustrates the point that provides the answer.

See the first screenshot (1018am potential 5min RBS zone)
skyuzs.gif


Price was now trending up on the 5min intermediate chart and as it retraced of the HH around 5435 area it found support at the potential RBS area shown between the dotted horizontal lines (ie the previous swing hi zone on that chart) and made a HL (circled in green) resulting in a with trend follow thru to a HH at 5445 area (before a sell offf to establish a new 5min downtrend)

Once identified, the 5min potential rbs zone (prev swing hi zone) saw a 1018am 1min trigger chart Re-entry set-up (2nd screenshot) develop at the 38.2% of the then intraday move up in that zone, providing a high probability opportunity to re-enter the trend present on the time frame above at what was a HL on that t/f (circled in green.) in this particular example at the time of the 1018am set-up both the 5min (intermediate) and 30min (trend t/f) macd hists stayed above the axis per the methodology adding to the technical confluence indicating a high probability set-up.

a2y6o1.gif


The example in next post deals with a similar re-entry to the 5min downtrend that developed from the 5445 area sell off 961.8% 5534-5307, yoday's asian session lows)
 
Last edited:
The sell-off from 5445 resistance saw a new 5min downtrend develop and as price retraced up off 5292 area to the 5min potential SBR zone (created by the previous swing lo )shown between the dotted lines in the screenshot below, a 1min Re-entry set-up again presented itself in that zone @ 1236pm at a LH on that t/f (circled in red) to indicate a high probability with trend trading opportunity. Like the example in the post above, both the 5min and 30min macd hists were below the axis at the point of the set-up for further technical confluence.
dngkqw.gif


The set-up is below
o8gevt.gif


Now the point of the posts,

Put simply;

1. Identify a trend (per classic price peak/valley analysis)
2. Identify the potential SBR in a downtrend, RBS in an uptrend on the time frame that the trend exists on.
3. Following a pullback in trend ..Identify a Re-entry set-up on the time frame below that of the trend in the SBR/RBS zone you have identified.


Now for those who have really understood the price action components of this system/methodology...Notice how on both these occassions the Re-entry set-up came at at HL/LH respectively on the chart into whose trend a Re-entry was indicated (ie the 5min) but on the t/f on which the re-entry set-up is sought, ie the lower 1min (trigger) t/f, the set-ups both came at at an effective H not a LH, leaving the chances of a with trend follow thru slightly less that if at a HL/LH on that t/f too. [actually on these occassions,.. both saw a with trend follow thru to new highs/lows respectively (see-ing attractive pip gains,.)
 
Last edited:
On the same theme as above, you can see from price action today in cable, price found resistance again at that previous 1hr swing hi 5445/50 area, this area rthen having had 3 tests as resistance. As price broke through to the upside it found resistance in the previous 1hr swing hi zone running 5492-5535 area, with both mni and thoms-reut suggesting offers lay in the 5490/00 area. A pullback resulted and price duly re-tested the now potential rbs area created by the 1hr triple top and more locally the 5min previous sw hi zone too. The screenshots below tell the story, with the actual 1min re-ent 2 set-up the last of the screenshots.

This additional previous 1hr swing hi zone x 3 provided extra potential rbs confluence to that of the intermediate 5min rbs zone (created by the upside breech of what was effectively the 3rd test of this 1hr res zone. )

f4me13.jpg

opaihe.gif

epf49v.gif
 
For the adventurous traders, you can see in the screenshot above [the last one,] the 1044am then 1052am Rev Extr / Rev B reversal set-ups respectively at the 5490/00 offers and 1hr prev sw hi zone. The 1044am Rev Extr had no 5min main chart supporting set-up unlike the 1052am Rev B set-up which had a 5min Rev Extr . Other resversal set-ups included the 1204pm Rev Aseq with 5min Rev B deeper in the prev 1hr/4hr sw hi zone..potential resistance.

G/l.
 
Screenshots below show the 5min Re-entry type 2 (Re-ent 2) supporting set-up into the 30min downtrend, (timed as a 1min Rev Extr ii) at the potential sbr shown in chart below that. Previous bids resided in the zone as did the nearby 61.8% of the intraday move down.

53qm4w.gif


Set-up came at zone circled in red, the previous 1hr swing lo zone, now potential sbr;

2ez1pu0.gif
 
Easy Summary of this Trading System/Methodology

1. Identify the conditions on trend and intermediate time frames
If a trend present is it with or against the longer time frame trend above your own trend t/f?

2. What was y/day's Daily candle?

3. Identify the trend t/f potential supp/res/sbr/rbs zones and the nearest intermediate t/f supp/res/sbr/rbs zone.
What else is in these previous price swing hi/lo zones to add confluence/potential strength to the area? (bids/offers/t-lines/fibs?)

4. Identify a trigger t/f set-up at one of the potential supp/res/sbr/rbs zones you have pre-identified.
Identify the individual candlestick price action as the trigger for entry within one of the set-ups.

5. Is the trigger set-up supported by a main chart set-up on the time frame (s) above it?

* If a Re-entry set-up on intermediate chart (timed as a trigger reversal set-up) it is best at a pre-identified potential sbr/rbs area on the trend t/f, into the trend t/f (+) trend, [trend t/f+ macd hists below axis-downtrend, above axis-uptrend.]

* If a Re-entry set-up on trigger chart it is best at a pre-identified potential sbr/rbs area on the intermediate t/f, into intermediate t/f (+) trend. [better when both intermediate and trend t/f macd histograms are above axis-uptrend, below axis-downtrend.]

* If a Reversal (against trend) set-up,
- How strong is the trend you are trading against?
- How many time frames above the trigger, does a supporting set-up exist upon?
- If present what is the character of the current trend, ie shallow pullbacks, deeper pull backs?

6. Stop best placed outside of the potential supp/res/sbr/rbs area you have pre-identified, and at which you have entered the market at a set-up. In this way if you are stopped out it is because the zone you identified as potential supp/res/sbr/rbs, falied to provide such.

7. Initial Target to be decided by how many time frames above the trigger a supporting set-up appears on / then over-target the momentum of the move.

Main caveats:

i. Be careful of expecting cricket score pip gains on a reversal against trend set-up, when contra to a strong trend, particularly if set-up only on trigger.

ii. Be careful of expecting a with trend-follow thru from re-entry set-ups when

a. Trend showing signs of exhaustion, indicated by large deviation from average daily/weekly range -and/or- regualr bullish/bearish divergence on the time frames above the re-entry set-up.

b. Re-entry set-up comes at anything other than an immediate HL/HL in uptrend, LH/LH in downtrend on the time frame it appears on/the time frame whose trend is being re-entered, repectively.

G/L
 
Last edited:
I've downloaded the PDF and will have a detailed read. looks complicated.
what is your % win rate with this system ?
 
I've downloaded the PDF and will have a detailed read. looks complicated.
what is your % win rate with this system ?

It's all summed up in the post above, but to condense it even further;

There is nothing complicated about a. identifying the market conditions on the time frames you are trading (trending/ranging?) then b. identifying potential support/resistance in the market, and c. memorising then identifying in realtime whatever repeatable high probability trigger to enter the market you have decided upon.

If any of these things are hard in themselves it's because you haven't actively engaged with the market. These are purely mechanical tasks. What is hard about any trading system/methodology that constitutes a trading edge is the ability to impliment it with impunity, and that requires a mastery of the necessary psychology that (probably) only experience can bring.

Whatever your trigger for entry whether it be the indicator based set-ups/patterns with individual price action as the actual trigger, discussed here, - or whether it be price action alone, it doesn't matter, (price action alone generally more reliable on the higher the time frames.) Look for a confluence (coming together) of all the technical factors you choose to employ that constitutes a trading edge, thus indicating a potentially higher probability trading opportunity.

As for strike rate (% of winning trades of total trades) this will improve with experience across any methodology/system. For me it is very high, but then I am the author of the system/methodology and I have traded it for a good period of time.

G/L
 
Last edited:
BBmac

Have been practising your system but without very good result. I blame myself for it as I believe there are stuff I have yet to master.

I will post my entrys here and hope that you can help.

I entered a trade today and it was a Extreme Reversal but in the end, the price shot up much more and caught me out.

Please have a look at the pictures attached.


Hi babymush i've looked at your screenshots and would comment, as under

a. Firstly i do not trade the chfjpy pairing and have no access to a chart or prevailing potential supp/res/sbr/rbs at the time in that pairing

Going purely from the charts you posted therefore

b. This is an improper Rev Extr set-up on 1min as you do not have the supp/res channels on the chaart so have no way of knowing whether the minimum 61.8 1st extreme resistance channel was breeched or not...this condition is integral to a rev extr set-up.

c. The 5min supporting set-up came at a slightly higher high than the lower high swing you were measuring the hidden divergence from 76.60area, thus invalidating the hidden divergence....oscillator hidden divergence indicating a potential re-entry to a downtrend must come at a price swing that is lower or equal to the price swing that you measuruing it from.

Overall bad luck I think, and still some reading to do on where the optimum places are to attempt a trend re-entry.
 
I have reposted your 5min chart with the additional comment shown;

xoo0v8.gif


Looking at that 5min chart, obviously I have no idea if you were able to identify any potential support at the bottom but a good Rev C there 76.20 area.
 
Ahhh ok ... I wonder if there is a problem with my 1 minute template. I deleted off the silver channels as I do not know what they are for....

I thikn I should re download your template from the first post again
 
Ahhh ok ... I wonder if there is a problem with my 1 minute template. I deleted off the silver channels as I do not know what they are for....

I thikn I should re download your template from the first post again

The screenshot below shows the properties of the silver Channels indicator, and it is the FutCh line In the Inputs tab that forms the Support/Resistance channels, set to 61.8, and 161.8 and additionally for the jpy pairings 261.8 and 423.6. In the Colours tab, lines 0-5 are blacked out with lines 6 & 7 being:

green: 61.8
red dotted: 161.8
----------------------------------
red wide dotted (1) 261.8
red wide dotted (2) 423.6

314czmh.gif
 
Last edited:
Sorry seen it....


From my diagram with the silver channels in, it looks like the 61.8 is breached right? Did I see it correctly?

But of course as you said there is no supporting reversal or re entry setup in the 5 mins time frame. Right?
 
Last edited:
Top