Comprehensive Trading System/Methodology

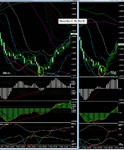
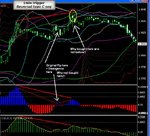
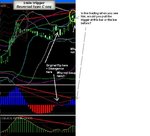
Another Good example of set-ups confirming each other today...attached is the 0906am gmt 1min trigger Rev Aii seq with the 5min confirming Rev B @ potential Resistance = offers/50% of 6197-5779. The set-up has seen +30+ pips from entry candle at 0906 am gmt.

G/L
 

Attachments

  • 1min RevAii seq.gif
    1min RevAii seq.gif
    26.6 KB · Views: 289
  • 5min Rev B.gif
    5min Rev B.gif
    16.3 KB · Views: 305
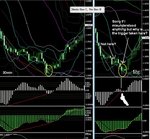
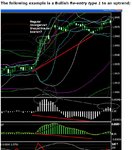
Looking for confirming set-ups on the one above your trigger can happen consecutively as you look up through the time frames. The attached 30min Rev C also had a 1hr Rev B at the recent 5600swing lo in gbpusd.

G/L.
 

Attachments

  • RevC & B.gif
    RevC & B.gif
    38.4 KB · Views: 329
I have been reading through the PDF today and went through and roughly understand the Reversal Set up A B and C but I would like to ask one question on C...

Please see attached picture

Please assist.
 

Attachments

  • 1a.JPG
    1a.JPG
    66.4 KB · Views: 294
  • 1b.JPG
    1b.JPG
    119.8 KB · Views: 272
By the way, I was reading through and I was seeing that we have to identify areas of Support/Resistance/SBR/RBS through the 1 hour and 4 hours chart and also Fibs

However, could I check.

When we are running through the different currency pairings, do we check the 1 min charts for setups first before identifying the SBR/RBS etc or do I identify the SBR/RBS first and then zoom in to the 1 min chart when prices are near those areas?

Which charts should I look at first to screen trades?
 
Looking for confirming set-ups on the one above your trigger can happen consecutively as you look up through the time frames. The attached 30min Rev C also had a 1hr Rev B at the recent 5600swing lo in gbpusd.

G/L.

Was looking at your last chart?

I have palced the questions in the chart
 

Attachments

  • 1c.JPG
    1c.JPG
    115.4 KB · Views: 265
By the way, I was reading through and I was seeing that we have to identify areas of Support/Resistance/SBR/RBS through the 1 hour and 4 hours chart and also Fibs

However, could I check.

When we are running through the different currency pairings, do we check the 1 min charts for setups first before identifying the SBR/RBS etc or do I identify the SBR/RBS first and then zoom in to the 1 min chart when prices are near those areas?

Which charts should I look at first to screen trades?


Although interesting to note the areas on the 4hr+, you really only need to know the potential supp/res/sbr/rbs on your intermediate and trend t/f's .

Once you know where the potential supp/res/sbr/rbs area is in the market then you look for trades on your trigger chart(lol)

identify the potential supp/res/sbr/rbs first because if you don't you won't know whether a trigger chart (+) set-up has presented itself at an area that may cause supp/res.
 
Was looking at your last chart?

I have palced the questions in the chart


I was only using these example to illustrate the way that time frames above a trigger t/f present supporting set-ups. The actual entry trigger in any set-up is always the first real reversal candle, on youir trigger chart.

On your screenshot 1c. with questions the set-up is where I circled and not where you qyestion beacuse that s where the set-up is. At the area before that highlighted and questioned by you in your screenshot there is no recognisable set-up. If you were using this 1hr example as the trigger in say a 1hr/4hr/daily combination then the actual trigger for entry in the set-up would be the first bullish reversal candle circled.
 
Last edited:
I have been reading through the PDF today and went through and roughly understand the Reversal Set up A B and C but I would like to ask one question on C...

Please see attached picture

Please assist.

I'm assuming by 'bought' you mean sell? in your screenshots 1a. and 1b.

Generally, it's about where the potential supp/res/sbr/rbs is. Aonly act at that even if a set-up looks to be developing just above/below it.
Specifically;
In your screenshots 1a....there was no peak above the axis in Osma for the necessary pattern of divergence in the Reversal type C set-up
In your screenshot 1b...the area you highlight didn't see the bols flip yet and price hadn't reached an equal or higher high for divergence in the oscillators to be present.

Hope this helps.
 
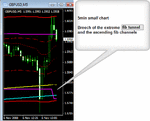
Look at the 1min Reversal extreme at 1204pm gmt today ...no 5min main chart supporting set-up but look at the 5min small chart confirming conditions. @ potential support = the 1hr ascending supp T/line [1st test]
 

Attachments

  • 1min Rev Extr.....gif
    1min Rev Extr.....gif
    19.3 KB · Views: 293
  • 5min small chart.gif
    5min small chart.gif
    16.1 KB · Views: 338
Last edited:
Similarly at 1227pm gmt there was another Rev Extr on 1min trigger then a Rev B at 1233pm, again with no 5min supporting set-up but 1 and 5min small charts confirming conditions [and incidentally a 15min Rev A]
 
Advice for preparation before the start of each Trading Session:

Mark Douglas (The Disciplined Trader, Trading In The Zone) calls it '...getting in the zone'

For me this consists of having as much pertinent information as I can about the market I am about to trade, and crucially involves identifying the potential Support/Resistance/SBR/RBS zones at the Previous Swing Hi/Lo areas on the intermediate and trend t/f’s at which I will look for the indicator based set-ups, confirmed by individual price action. The steps I go through are listed below;

General preparation;
1. Make a mental Note of Yesterday's candle/last 4hr candle direction. Note too the current conditions that exist on the trend and intermediate time frames (trend or range?) Have a look too at the longer time frame trend.

2. Update Fibs and Previous Swing Hi/Lo areas on the trend t/f chart+, and any relevant Trend lines on the trend t/f +

3. Be aware of any upcoming data releases/speeches etc.

Then specifically;

4. Compile an A4 sheet detailing;
a. Asian (or previous session if not Asian, ie London/European or U.s) Hi/Lo
b. Yesterday's Hi and lo
c. Any bids/offers touted in the market
d. Daily Pivot, S3-R3.

5. Pre-identify the Potential Supp/Res/SBR/RBS in the market by making a note of;
a. The trend t/f Previous Swing Hi/Lo zones.
b. The nearest intermediate t/f Previous Swing Hi/Lo zones,
(noting and updating these zones as price action develops.)

* Note whether any of the other factors that may cause Support or Resistance, occur in each Previous Swing Hi/Lo zone.


I am then ready to start trading, aware of the prevailing market conditions (trend or range) on the intermediate and trend time frames and whether these are with or against the prevailing trend on the longer t/f's,) as well as having an accurate idea of which areas in the market may provide Support/Resistance.
 
Keep in mind, this trading system/methodology hinges on the accurate identification of potential support/resistance, identifying trend via classic peak/valley price overall action analysis and the entry trigger of individual price action as one of the indicator based set-ups suggests that such a pre-identified potential support/resistance area has a geater chance of producing a favourable result than not.

In using technical indicators ask not what they are doing but think what they are telling you aboutt price. These tech indicator based set-ups are merely a tool to pinpoint the potentially optimum entry point, and as such are just repeatable hi-probability patterns that if used, require memorising. This will get easier and become 2nd nature with experience.

G/L
 
Although interesting to note the areas on the 4hr+, you really only need to know the potential supp/res/sbr/rbs on your intermediate and trend t/f's .

Once you know where the potential supp/res/sbr/rbs area is in the market then you look for trades on your trigger chart(lol)

identify the potential supp/res/sbr/rbs first because if you don't you won't know whether a trigger chart (+) set-up has presented itself at an area that may cause supp/res.

Which will mean that if I am using:

1min Trigger
5min Intermediate
30mins Trend

I will indentify the supp/res/sbr/rbs areas in the 5 mins and 30mins TF right?
 
I was only using these example to illustrate the way that time frames above a trigger t/f present supporting set-ups. The actual entry trigger in any set-up is always the first real reversal candle, on youir trigger chart.

On your screenshot 1c. with questions the set-up is where I circled and not where you qyestion beacuse that s where the set-up is. At the area before that highlighted and questioned by you in your screenshot there is no recognisable set-up. If you were using this 1hr example as the trigger in say a 1hr/4hr/daily combination then the actual trigger for entry in the set-up would be the first bullish reversal candle circled.


BB I am reading carefully through each of your reply and will reply each as I read through.

By the way, I don't mean to "attack" your setups or trigger points but would truly wish to understand why you got in at that area and not some other areas. Hope you understand.

Referring to 1C, if you see the arrow that I pointed first at the 1H chart, There was a Bollinger 10 going into the 20/40 Bol + OSMA Divergence + Doji for price confirmation

Why is there no valid setup there? Did I miss out anything?

Which bullish reversal candle are we referring to as the trigger? The down candlestick or the small up candlestick?
 
I'm assuming by 'bought' you mean sell? in your screenshots 1a. and 1b.

Generally, it's about where the potential supp/res/sbr/rbs is. Aonly act at that even if a set-up looks to be developing just above/below it.
Specifically;
In your screenshots 1a....there was no peak above the axis in Osma for the necessary pattern of divergence in the Reversal type C set-up
In your screenshot 1b...the area you highlight didn't see the bols flip yet and price hadn't reached an equal or higher high for divergence in the oscillators to be present.

Hope this helps.

Ahhh I understand. In 1B) I read through your PDF again and saw that we need Regular SEPARATE peaks divergence and the other one the price have not reached a new high. The arrow pointed to the bar just after the bol flip but it has not reach an equal or new high yet for the setup to be valid.

However, I will like to ask you another question, 1B1, Would you pull the trigger there or the bar before as we will not know in live trading how high the OSMA will go up to so just wanted to understand this portion.
 

Attachments

  • 1b1.JPG
    1b1.JPG
    79 KB · Views: 244
By the way, you had a custom indicator in your PDF that shows avg range - Are you able to share that? :)
 
Wow I was looking through the live charts and you make it seem so easy.

There are so many lines, fib tunnels, Sliver channels, BOls, that I am getting confused ... wondering if I can ever understand the system lolz :)
 
Ahhh I understand. In 1B) I read through your PDF again and saw that we need Regular SEPARATE peaks divergence and the other one the price have not reached a new high. The arrow pointed to the bar just after the bol flip but it has not reach an equal or new high yet for the setup to be valid.

However, I will like to ask you another question, 1B1, Would you pull the trigger there or the bar before as we will not know in live trading how high the OSMA will go up to so just wanted to understand this portion.

The trigger is the first Reversal candle in the set-up at potential supp/res/sbr/rbs.
 
I was reading through your system again and found something i do not understand about the divergences of the OSMA.

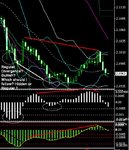
Whenever there is a hidden divergence, there seems to also be a regular divergence forming, so which signal should I take?

Let me show it in this picture. Maybe I got something wrong.
 

Attachments

  • 1d.JPG
    1d.JPG
    107.3 KB · Views: 262
  • 1e.JPG
    1e.JPG
    82.6 KB · Views: 285
Top