Comprehensive Trading System/Methodology

Hi,


Example today 0857am gmt...Rev Extr ii, 5min Re-entry type 2 @ potential sbr = prev 5min and 1hr swing lo zones and 38.2% 6495-6108,...has seen +30+ pips from a 6247bid entry (although into the 30min trend t/f downtrend @ a LH, the set-up came at a H on the 5min intermediate t/f, so less chance of a 'with trend follow thru,' so either stop to b/e or take profit...)

G/L

As if to prove the point above, price found support at the previous 5min LH, now a HL with an 0910am gmt Re-entry type 2 set-up back into the 5min uptrend established by a HL then H off the LL current i/day 6108low and LH. This set-up saw +20+ pips.

G/L
 
For those trying to make sense of this trading system/methodology, If you correctly identified the zones at the prev swing Hi/Lo areas on the 1hr (proxy for 30min trend t/f) and 5min (intermediate t/f)and any other potential supp/res factors within them, (updating particularly the 5min intermediate zones as price develops,) you might have spotted the following set-ups during the London/European session:

Times are gmt+2
1057am Rev Extrii, 5min Re-ent 2 (into 30min+ downtrend, 30min+ macd hists below axis...set-up @ a LH 30min, H on 5min) 1min small chart confirms @ pot sbr/res = prev 1hr sw L zone...saw +30+
1110am Re-ent 2 (into 5min uptrend, 5min macd hist above axis,...set-up @ a Hl 5min) @ pot rbs = prev 5min sw H zone...saw +30+
1220pm Rev B, no 5min, 1/5min small charts confirm with 5min ascending fib channel breech @ pot supp = prev 1hr sw H zone , 50% 5539-6673...saw +30+
1227pm Re-ent 1 (into weak 5min downtrend, 5/30macd hist below axis) @ pot sbr = prev 5min sw L zone....saw +7best.
1244pm Rev Extr (imperfect re 60bol), no 5min main chart set-up confirm, 1/5min small charts confirm @ pot res = minor prev 5min sw L zone...saw +30+
1307pm Rev Extr, no 5min main chart set-up confirm, 1/5min small charts confirm @ pot res =prev 1hr sw L zone...saw +30+
1317pm Re-ent 4 (into v.weak 5min uptrend, 5min macd hist above axis) @ pot rbs = prev 5min sw H zone....saw +15+
1410/11pm Re-ent 2 (into v.weak 5min downtrend, 5/30min macd hists+ below axis) @ pot res = prev 5min sw H zone , Y/day's H...saw +30+

You will also notice, (generally speaking) that as price develops it is the 1hr t/f zones that provide the anti-trend supp or res and the intermediate and trend t/f zones that provide the potential sbr/rbs.

G/L
 
As an example the 1057am (gmt+2) set-up...look at the 1hr chart below and see the prev swing lo zone identified and shown between the dotted lines that may Provide Res (SBR) ...at a LH on that chart.

The 5min chart attached below shows the hidden divergence based Re-entry (to trend) set-up at that LH on the 1hr (proxy for 30min Trend t/f) chart, circled in yellow.

But note that on the 5min intermediate t/f that the Re-entry set-up (indicating a high probability entry into the higher t/f trend) appears at a H on that intermediate t/f, after a HL, not an immediate LH like on the trend t/f. (The 5min chart was effectively in a weak uptrend so that an re-entry to the highertrend t/f trend might not follow thru for new lows) ...in fact as price progressed it made a slightly HL on that 1hr t/f testing the then intraday lows around 6110, £ buying then saw it go up to a H above the last LH of the downtrend on that t/f....that said the set-up was still worth a good pip gain.

G/L
 

Attachments

  • 1hr gbpusd.gif
    1hr gbpusd.gif
    10.3 KB · Views: 352
  • 5min gbpusd.gif
    5min gbpusd.gif
    23.2 KB · Views: 343
The screenshot below shows 2 1min trigger chart set-ups.

1, The 1438pm gmt Rev B at the 6100/10bids potential Support that was confirmed by Reversal set-ups to the 15min chart too...saw +80+ pips available from the move.

2. The 1445pm gmt Re-entry type 1 at the potential SBR of the breeched 1hr ascending support trend line and prev 1hr sw L zone also potential SBR. ..this set-up saw +30+ pips available.

The 2nd screenshot shows thursday's Daily candle, a Doji...a clue for today's direction in this instrument??

G/L
 

Attachments

  • 1min trigger chart.gif
    1min trigger chart.gif
    24.6 KB · Views: 360
  • Thursdays candle gbpusd.gif
    Thursdays candle gbpusd.gif
    8.2 KB · Views: 340
Wow great info given.

Thank you will try to study it and come back to you for advice on your system.
 
Just a quick post to say that what I have read so far is intersting as much of the thinking ties in with my own. Unfortunately I can't yet comment as I need to read the pdf in full and digest it - that might take some time. However I am subscribing to the thread and appreciate the sharing. Will try and add something useful when I am able to do so.
 
More examples from Fri 31st Oct 08

Continuing with gbpusd:

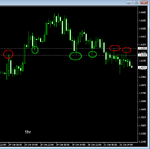
The screenshot below shows the potential previous 1hr swing Lo area (the zone between the dotted white lines per the Identifying Potential Supp/Res/SBr/RBS methodology) on the 1hr chart from Friday...notice how it had previously been resistance too (circled in red) This was the area identified on this trend t/f (remember the 1hr chart is used as a proxy for the 30min trend t/f in respect of identifying 'trend t/f' potential supp/res/sbr/rbs)

As price challenged the potenial sbr zone 1517pm gmt saw a 1min [trigger t/f] Reversal type A with a 5min Re-entry type 4 set-up (marked as point a on attached 5min screenshot below) and a second test of the area saw a 1535pm gmt 1min Reversal type Aii seq with a 5min Re-entry type 2 this time, (marked as point b on the attached 5min chart screencap.) Both these set-ups showed over 40pips gain although neither resulted in a with trend follow thru as although they fell at a LH on the trend t/f they fell at a H then a HH on the 5min intermediate t/f, thus lessening the statistical probability of a with trend follow thru (from the point of those set-ups) as discussed in a previous post above.

As the potential SBR area was challenged again later in the day (this time proven to offer resistance) 1739/42pm gmt saw a 1min triggr Reversal B / C with a 5min Reversal C set-up and this time a 30min Re-entry type 4 that saw a 170+ pip sell off
 

Attachments

  • gbpusd 1hr potential SBR.gif
    gbpusd 1hr potential SBR.gif
    15.5 KB · Views: 342
  • 1517pm 1min Rev A.gif
    1517pm 1min Rev A.gif
    20 KB · Views: 327
  • 1535pm 1min Rev A ii seq.gif
    1535pm 1min Rev A ii seq.gif
    26.4 KB · Views: 300
  • 5min Re-entry 4 then 2.gif
    5min Re-entry 4 then 2.gif
    20.7 KB · Views: 320
Last edited:
General advice

Pre-identifying the potential Supp/Res/SBR/RBS zones on the trend and intermediate time frames is effectively planning the areas at which you are seeking a set-up to develop (or not) on the trigger chart (+,) in advance.

This forms the basis of the 'trading plan' and tactical approach to the market.

Over on Trader-Dante's thread he talks about identifying candlestick's like pinbars and inside bars as a trigger fo entry at similarly pre- identified potential Support/Resistance areas on the higher time frame. (Of course he is concentrating on the higher time frames.) This system/methodology has the same basic methodology but uses indicator pattern set-ups confirmed by individual price action (like pinbars etc...) at such pre-identified potential Supp/res/SBR/RBS areas because price action is less reliable on the lower time frames, so the indicator patterns help to pinpoint the optimum entry points.

Identifying the trend and intermediate t/f potential Supp/Res/SBR/RBS zones per the methodology is if you like, one quarter of the equation. Identifying one of the oscillator divergence/extreme readings and band/channel deviation based set-ups give 2 more quarters and individual price action confirmation provides the 4th qurater needed to indicate that a high probability trading opportunity exists.

In a sense, it is the addition of the last 3 quarter parts that indicate whether a pre-identified Potential Supp/Res/SBR/RBS zone may indeed actually result in Supp/Res/SBR/RBS.

Having all 4 quarter parts together making up the whole, results in a confluence of technical reasons to enter the market....with a high degree of confidence of a successful outcome over any given sample of such set-ups.
 
Last edited:
  • Like
Reactions: BSD
In the attached zip file are some custom alerts for gbpusd, eurusd, eurjpy and usdchf.

These (or any alert of your choice) can be useful to alert you to price's arrival at a trend t/f potential Supp/Res/SBR/RBS area.


To use unzip to My Computer>Local Disk/Drive C:>Program Files>MT4>Sounds.

To set any alert in MT4 go to File>Terminal >Alert ... -then right click on the tab- > Create.

G/L.
 

Attachments

  • alerts.zip
    226.8 KB · Views: 251
Hi BB

I tried reading through your PDF files and understanding them.

Just 2 points to clarify,

Extreme indicators Setup - You said that you have set the levels, OSMA, MACD and CCI have been set or what levels are considered extreme

Bol flip, Don't quite understand that part. Could you clarify it on how I use the Bol flip to enter a trade? When you said 10/20 flip, do I enter when the 10 BOL moves inside 20 BOL or ?

Thank you
 
Need to also confirm something, you mentioned that the set up from the Divergences has to come from the Trend Timeframe and also the INtermediate time frame while taking the trigger from the Trigger time frame

could I confirm that we will wait for OSMA and MACD to diverge in the 30min and 5 min time frame and then go down to the 1 min time frame to take the trade based on the Bollinger Flip?

I saw in all your charts that you were mentioning the Bollinger flips with the divergences in the same time frame. Is it necessary to have divergence in the Trigger time frame too?
 
Hi BB
1...Extreme indicators Setup - You said that you have set the levels, OSMA, MACD and CCI have been set or what levels are considered extreme

2...Bol flip, Don't quite understand that part. Could you clarify it on how I use the Bol flip to enter a trade? When you said 10/20 flip, do I enter when the 10 BOL moves inside 20 BOL or ?

Thank you

1...The lvels for those oscillators are set on the chart templates for each time frame, but of course as volatility increases these may vary....the real component needed in the Reversal extreme set-up is the cci hook back into the bol from extremes at a pre-identified supp/res/sbr/rbs zone.

2...A 4bol flip only figures in 2 set-ups, the Rev A and Rev Extr, but of course preceeds all tghe other Rev set-ups...a 10/20flip such as a Rev C, Re-ent 1 and 2 is effectively the 20bol moving inside the 10...and like in all bol flips it is the longer setting bols flipping inside the shorter ones.

Hope this helps.
 
Need to also confirm something, you mentioned that the set up from the Divergences has to come from the Trend Timeframe and also the INtermediate time frame while taking the trigger from the Trigger time frame

could I confirm that we will wait for OSMA and MACD to diverge in the 30min and 5 min time frame and then go down to the 1 min time frame to take the trade based on the Bollinger Flip?

I saw in all your charts that you were mentioning the Bollinger flips with the divergences in the same time frame. Is it necessary to have divergence in the Trigger time frame too?

The trigger time frame is where you look for set-ups. A trigger t/f set-up with no intermediate t/f (+) confirming main chart set-up can be executed at an intermediate or trend t/f potential supp/res/sbr/rbs zone -but- a trigger t/f that has an intermediate t/f confirming set-up would need to be executed only at a trend t/f potential supp/res/sbr/rbs zone.

For example a trigger Rev Extr with say an intermediate Re-entry 2 would need a trend t/f potential SBR/RBS zone identified, at which to execute it.

The trigger is where you start, if you see confirming set-ups on the intermediate t/f+ so much the better.

Hope this clarifies the points you raise.
 
Last edited:
The trigger time frame is where you look for set-ups. A trigger t/f set-up with no intermediate t/f (+) confirming main chart set-up can be executed at an intermediate or trend t/f potential supp/res/sbr/rbs zone -but- a trigger t/f that has an intermediate t/f confirming set-up would need to be executed only at a trend t/f potential supp/res/sbr/rbs zone.

It seems that both with or without the intermediate T/F confirmation setup, you can excuted at the trend T/F potential supp/res/sbr/rbs ozne

Don't quite understand this part


Yeh, the 1min trigger chart is where you seek to identify a set-up. Specifically you can execute:

a. a 1min trigger Re-entry set-up at a 5min intermediate t/f potential sbr/rbs zone [into a 5min intermediate trend (+) t/f]
b. a 1min Reversal set-up at a 5min intermediate or trend t/f potential supp/res zone that doesn't have a 5min intermediate t/f (+) set-up to support the trigger set-up (better if it does of course) and in these circunstances you would look for further technical confluence by way of the small chart conditions.

Where a 1min trigger set-up has a 5min intermediate (+) set-up this will be:

c. A 1min Reversal with a 5min supporting Reversal set-up @ a trend t/f potential supp/res zone.
d. A 1min Reversal set-up with a 5min Re-entry set-up at a trend t/f potential sbr/rbs zone [into the trend t/f trend.]

Hope this helps
 
Was reading through it again but don't really get the entry point of where shoudl I enter. Should I enter when the 20bol moves into the 10bol or?

For all set-ups your trigger is the first real reversal candle at the pre-identified supp/res/sbr/rbs zone within the set-up, ie when;

i. in a Rev A and Rev Extreme the 4 bol flip occurs
ii. in a Rev Aii the 3bol flip occurs inside or straddling the 60bol
iii. in a Rev B the 10bol comes inside the 40 (and possibly 60) bol after the original 4bol flip
iv. in a Rev C, the 10 and 20 bols flip again (after the original 4bol flip) inside or straddling the 60 bol.
v. in a Rev Extreme ii, the 10bol comes inside the 20bol.

vi. in a Re-entry type 1 and 2, the 20bol comes inside the 10bol
vii. in a Re-entry type 3, no bols are involved (10bol the nearest)
viii. in a Re-entry type 4, the 10bol is involved only.

Hope this helps.
 
Last edited:
Thanks BB

Will read through what you have written and try to make sense of it.

Do you use MSN? Would you be able to PM me your MSN Id?
 
The trigger time frame is where you look for set-ups. A trigger t/f set-up with no intermediate t/f (+) confirming main chart set-up can be executed at an intermediate or trend t/f potential supp/res/sbr/rbs zone -but- a trigger t/f that has an intermediate t/f confirming set-up would need to be executed only at a trend t/f potential supp/res/sbr/rbs zone.

It seems that both with or without the intermediate T/F confirmation setup, you can excuted at the trend T/F potential supp/res/sbr/rbs ozne

Don't quite understand this part
 
1...The lvels for those oscillators are set on the chart templates for each time frame, but of course as volatility increases these may vary....the real component needed in the Reversal extreme set-up is the cci hook back into the bol from extremes at a pre-identified supp/res/sbr/rbs zone.

2...A 4bol flip only figures in 2 set-ups, the Rev A and Rev Extr, but of course preceeds all tghe other Rev set-ups...a 10/20flip such as a Rev C, Re-ent 1 and 2 is effectively the 20bol moving inside the 10...and like in all bol flips it is the longer setting bols flipping inside the shorter ones.

Hope this helps.
Was reading through it again but don't really get the entry point of where shoudl I enter. Should I enter when the 20bol moves into the 10bol or?
 
babymush.
reread it.you need to practice the setups.it takes a few hours before you can understand what bbmac is trying to teach.it is well worth the effort.
what he is saying is that you are looking for 2 different kind of diveregnce.one is for reentry into the trend ,the oher for reversals.the bolli flips are just confirming these moves
 
Ok dentist. I do really think so. Maybe I should take it in small bites and learn 1 setup at a time before moving on to the new setup. It seems really interesting and will take my time to learn it.

Thank you
 
Top