Week 11 including some food for thought.
The overall AEX outlook has changed last week from an Elliott point of view looking at it from the helicopter. A number of weeks ago I explained how I use the different wave pattern alternatives found and the combined outcome shows doubt again after last weeks trading. Not a signal to immediately wrap up all your long positions and turn them into shorts more a signal to be alert since the up and down patterns have similar characteristics which effectively means that they signal neutral (+ and – is neutral) in a long term up trending market. Using a technique like Elliot patterns is not something you pick up easily and an analyst screaming extreme index targets around using Elliott as his credentials can not be taken seriously. However it seems to me that people rather follow such a tribe paying the Chief and lose money trading than spend time and brain to think.
Last weeks findings are still valid and the preferred wave 2 has now found it’s place at 469,85 same observation the inter wave time relationship is way off. The 38,2% retracement level has been met and the next is the 50% level at 461,01 also spread over the net so let’s include the 61,8% level as well at 448,87 so the “feest der herkenning” is complete. If you are interested just let me know and I will generate idiot-proof analysis for each and every extreme index value you come up with, what?, do I hear AEX 100 over there, and the 70 guy woke up as well, I did not hear anybody shouting 1000 yet. The guy who first mentioned Elliott to me does his analysis and his conclusion is: 1) the AEX has come to the 50% retracement level and that’s our signal to look for short positions at 469 targeting 410 stop-loss 512 ; 2) the AEX retraced more than 50% and is looking to find it’s way back up so Long at 512 and stop loss 469. I did not read any analysis/conclusions from him for weeks I just know where he is coming from so I copied his line of thinking, DO NOT USE THIS FOR TRADING. Please gentle people do not get ahead of yourselves here.
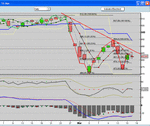
Now let’s focus a bit more on the two pivots 512,47 and 469,85 to move in the direction of next weeks road map for the trades to win. Mind you the result you get from any Elliott pattern analysis is static and at the end of the day a completely different pattern might pop-up as the one. You can do two things: 1) join the SOB-club that rejects everything since it does not work 2) you can think for a minute and use the goodie’s and isolate the weaknesses. The present 512,47 pattern with the best score referenced towards the Elliott definitions is called DoubleZigZagC with the first wave W on 469,85 and the second wave X on 492,02 so the third Y is now heading down and has target levels 460,40 and 451,10 providing this is the pattern that’s the final one. Not so fast.
Before you place your bets first get your act together and let’s look at the 469,85 pivot for a minute. This is very good example where the Elliott static character exposes itself in full glory by throwing a number of pattern options at you that if you simply look at them are completely out of order. Don’t worry be happy the 469,85 upswing can be monitored with a number of other techniques as you can read in the daily posts. From an overall picture in this swing the retracement levels are indications to work with and the two relevant right now are 50% at 491,16 and 61,8% at 496,19. At the 38,2% level last week we have found turning potential used it and were thrown out again by the excellent working trading rules. Currently at the 50% level the position is short and the guards are in place.
This week I took a few words more to put Elliott in perspective since I pick up Stjekel signals that the used timeframes are unclear. Elliot Analysis uses wave labels in different degrees which are linked to time but not as strict as you are used to by using week, day, hour, etc. The moment I started using Elliot I started using time in a totally different perspective and that might be a bit confusion, I use typically six (yes 6) wave degrees in order for you to find your way I refer to the actual pivots in price and to keep this readable I do mot repeat the obvious ones (however you can find them in the earlier posts). When I started using Gann, time became an even more important piece of my analysis and trading. And now it has become such an important piece I am studying specific area’s to learn more about the time aspect since I am convinced that time is an ignored factor. The third factor is volume and I did not even cover that in a way I feel comfortable with although my appetite completely vanishes when I read that someone when the trading volume increases concludes the market intends to move up (die klap is geen daalder waard). I might be completely wrong here but my understanding has always been that volume shows the number of actual trade transactions meaning entity A buys and entity B sells. So I smiled when the self exposed prime flock member did ask if anybody could help him find AEX volume data. Trust you get the picture!!!
As I explained in my introduction (Thread Donderdag 13 juli 2006 post nr 17) at the T2W forum I make an explicit difference between the two mainstream Technical Analysis tools and techniques: the lagging ones and the reading ones. While 99% of what you are being offered is about lagging indicators and techniques I focus primarily on the reading side and even some of the lagging bits and pieces can be used in a specific setting as reading. And no Sir there is no such thing like “The Holy Grail” and I am not looking for it either. It has been my conviction that crossing indicators and techniques should be able to supply a more than excellent road map for the trades to win, the Brown book was the first acknowledgement from a different source. It’s not a complete set of instructions you can set up and collect your trades to win, it’s more an invite and stimulation to a undertake an discovery journey. Hard work.
Let me in more accordance with the traditionally used timeframes shortly recap the KVKD trending area systems I have developed and use for guidance and reflection. The daily version left the 409,56 system on February 28th and I am currently scaling a new one depending on the actual figures it will be a 512,47 down one or 469,85 up one. The weekly 307,31 version survived the recent index drop and in fact turned it this week so this coming week will be exciting. The monthly 217,80 one has two versions which both allow further index drop. In this respect especially for Pacito; this is where we figure out how the anticipated serious 2007 drop looks like when this drop is the one versus the autumn possibility.
The introduction of Nol1 I applaud extremely since I have been experimenting all sorts of exotic option flavors some time ago even guided by so called experts. Basically this route failed in my case due to the lack of vision the underlying value movement. If I read between the Nol1 lines – sorry bad habit I know – the potential has been diminished by the computerization of the financial community and the use of hard and software by individuals on a large scale (guilty as charged). This doesn’t mean I am not triggered by the brainteaser question: “did you make the up most money wise out of your vision by using the best possible instruments”. Without going into too much detail at this point in time I use strict rules to monitor and qualify my trading in the sense of target index points performance. The two main instruments I use are index futures which bring EURO 200,- per index point and sold index option positions bring half plus some extra when volatility is up a bit. For investments I use the major price swings in the individual chart as reference to buy and/or sell the pieces accompanied when appropriate by sold option pieces. Due to infrastructural challenges – read software suppliers do not deliver what they claim and data suppliers delivering way below acceptable quality - my investments system is not yet fully up to speed and level I want it to be. As long as it’s making money it will have to do for now since I am spending too much time working lately as it is.
Hence I have come to my two page limit.
Have fun trading this week.
March 9th found Candles
High wave
Spinning top White
Spinning top neutral


