Clown's 2007 outlook is work in progress

Rhythm

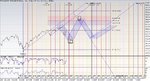
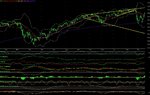
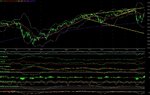
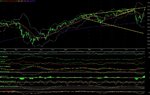
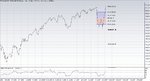
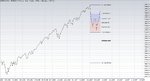
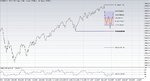
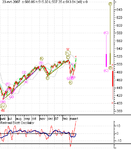
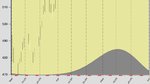
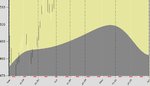
Maybe about next week. Surely about the future. I already posted my view and for the moment I'll stick to it. Just a few observations about time. It's too complicated to add the price and complete the picture. However, keep in mind that Gann pointed at the importance of rhythm.
Pacito

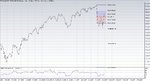
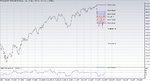
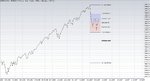
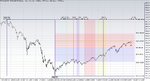
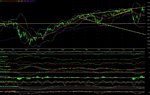
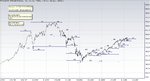
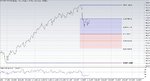
2 S&P500 didn't reach the last top. In fact, only the AEX surpassed the previous top thanks to ABN.
 

Attachments

  • time.jpg
    time.jpg
    239.8 KB · Views: 171
  • ispx.jpg
    ispx.jpg
    293.6 KB · Views: 143
Last edited:
AEX leading?

Surprise, surprise. I surely didn't see this coming. Will the AEX be the leading index, or will it be thrown back into pace with the others. It looks optimistic, but the CAC40 as well as the DAX have not surpassed their previous top. The DOW didn't, but the S&P500 did. What's next?
Call/Put ratio 1,9. RSI did reach 55 on the AEX. DMI crossed. The AEX is still in the channel I draw as prediction. So I suppose it should go down tomorrow. It's a clear sky and when I look up I see the lesser bear, which has stars of the 2nd, 3rd ,4th and 5th magnitude. And after 5 comes.......
I'm curious about tomorrow.
Pacito
 

Attachments

  • aex.jpg
    aex.jpg
    283.7 KB · Views: 138
  • dax.jpg
    dax.jpg
    289.7 KB · Views: 125
  • cac40.jpg
    cac40.jpg
    301.5 KB · Views: 132
  • dow.jpg
    dow.jpg
    283.8 KB · Views: 132
  • S&P.jpg
    S&P.jpg
    293.8 KB · Views: 132
  • aexprog.jpg
    aexprog.jpg
    416.3 KB · Views: 139
Last edited:
Strong bulls

Indeed strong play by the bulls yesterday at the end of the day. During the whole day the bull support level in the RSI was tested I think maybe 10 times after which it went up after being relatively flat most of the day and not being able to pass bear resistance either.

As you say, RSI in the daily chart is up and closing in on the bear resistance. That will be a key point in time. From a cycle perspective it still has room to go up and test it, so... Whether that will happen I am not sure, as the cycle in the hourly chart is stretched with the RSI at relatively high levels, and the 15' chart already has shown a first move down in the cycle and in the RSI which will turn the hourly chart around as well if continued.

It is interesting to see that in the 15' chart there is a slight bearish divergence in the RSI with the cycle ready for a downward turn now.

Currently in the 5' and 1' chart we see a cycle turning south with the 1' chart breaking bull support. First thing to see today is the bull support in the 5' chart which was holding out strong yesterday.

Have a good trading day!

Stjekel
 
eerst een lekker bakkie doen

The friendly opening allowed me to shop this morning so the games can begin once the others wake up. No more Hurst Cycle Finding?! Well since you adopted the RSI it’s time to put the move yesterday in perspective and one of the tools you use is The Derivative Oscillator. The next you need to cover is the potential downwards and well there is some.

Looking at the sky the stars show you it’s bound to be a downer today.

So have fun today

EDIT:
Looking for reference:
12-13u first 499,68 second 505,99 TrSW 499,13
13-14u first check second 505,57 TrSW 499,70
14-15u first check second 505,27 TrSW 500,85
15-16u first check second 505,37 TrSW 500,87
The Derivative Oscillator did not score higher value.
16-17u first check second 505,08 TrSW 500,96
The Derivative Oscillator did score a lower value. (even the TrSW was hit and entered again)
 

Attachments

  • aaa2.jpg
    aaa2.jpg
    79.8 KB · Views: 190
  • aaa2.jpg
    aaa2.jpg
    83 KB · Views: 177
Last edited:
If only our soccer team was just as strong ;-)

Beating most other markets again... the AEX was again in for a winning day... Hopefully Oranje will show the same spirit and results next year at the EURO2008 ;-) (just subscribed to try and get some tickets for next year's tournament in Switzerland/Austria...).

Back to what I see in the market....

Week Chart
Still in uptrend but with diminishing power. Bounce was made in week 10 as we know, with an RSI that is still in the bull range and could provide a stepping stone for higher highs later. Due to todays upday, the cycle turned and is now directed upward... Last few years if this happened, the positive trend was back in charge again... But OK, it still needs to be confirmed... But we should not exclude the possibility a possible upward trend (for weeks) based upon this sign.

Day Chart
Again a strong upday today which further moved the cycle as well as the RSI upward. This cycle still has room to push the FTI further upward. The RSI, however, is now approaching the upper range of the bear range (and GJN's down trendline) and it will be key to see whether it can break back into bull territory, or that it will top and go back into bear territory. I guess we can expect this to be concluded tomorrow or at least next few days. If it breaks through the bear resistance, we can expect the cycle on the weekly chart to continue its way north and confirm the longer term uptrend will be re-taken.

Hour Chart
The cycle was way up with little room to further move upward. Due to the moves in the second half of the afternoon, it now slowly started its downward turn.
The RSI has been moving consistently up toward overbought regions since March 14. Today the RSI cooled off somewhat but landed upon the uptrendline from March 14th from which it got support in the end of today's session.
So although I still expect some further cooling down, knowing that it landed on the RSI trendline may delay a move south and help breaking through the bear resistance in the hourly chart.
This trendline (and the bull support) will therefore have our attention tomorrow. The moves in the 15' Chart direct us toward the possibilities for this.

15' Chart
Cycle stayed stretched until midway the afternoon when it started to turn southward. But not for long as at the end of the session it turned its way back up.
The RSI as well was in overbought regions almost for all of the day. It moved in parallel with the cycle to bounce up in the last hour of the session, and still well in bull territory.
So at this level as well, still signs that the uptrend is not necessarily finished and that the market doesn't see the need yet to further cool down the RSI in the hourly chart.

5' Chart
Some tradeable cycles in the early morning, after which the cycle went north and stayed stretched during a big part of the day. Second half of the afternoon it then made a downward move at which the RSI tested its bull-support (after the 1' Chart showed some weaknesses earlier).
Although it did break it slightly, it was not a convincing move and it retook its way back up without making a top yet below bear resistance. So no real confirmation yet that we are in for a continued downtrend at the short term. The cycle as well was and is directed upward for the moment which didn't allow the RSI to top below bear resistance (yet?).
This also meant that the movement was still up at the end of the day (with the 1' chart indicating the cycle turning south, but the RSI still back in bull territory after the previous cycle).

At the moment our friends on the other side confirm the view above that there is still room toward the north and we will not necessarily turn south unless proven otherwise.

Summarized...
The AEX/FTI is still very strong I think. During the whole day the 1' RSI hardly ever tested its bull support levels, and the 5' RSI was even further away from that level than yesterday.
However, at the end of the day, we saw the first cracks in the chart... but not very convincing (yet?) I think.
Although the upward move is losing some force, it still has room based upon the cycles and the RSI in various time frames.
Key is to keep a close eye on the RSI in the day chart I think. More detailed time frames tell me we still have some room, but breaking this RSI resistance, will give a lot more room at that level.
But if we fail, the indicators that are stretched in the more short-term time frames (mostly the hourly chart) could release a lot of their tension and bring us down significantly over the next days (cycle on the hourly chart is about 5-10 days, so a full move up/down in about 2-5 days).

Happy trading again tomorrow!

Stjekel
 
Change of view?

Not for the moment. Tomorrow morning the aex wil undoubtly cross the line I put in my projection, but I'm not sure it will stay there during the day. If I look at the charts there's unmistakebly an uptrend. The RSI is on the brink of braking into bull territory. Volatility is high. 19,89. DMI crossed yesterday. Long MACD formed a bottom. Short MACD is rising to a top. Short stochastics has nearly formed a top. Long stochastics is still down. Cardwell is rising.
Fibonaccilevel of 38,2 has cracked for the AEX ( or if you look at it the other way around, the 61,8 level). BUT it didn't for the DAX. There should be a resistancelevel on 502,59, but that will be broken during the day. It all depends on the closing tomorrow. The next resistance will be the former top at 511,17. So I should be very bullish. Well, I'm not. I have covered my written calls for april so that Bernanke could not ruin my party. I think I will put away the protection first thing in the morning. I see the event of tonight as an interruption of what was going on, an ABC wave. Now its time for the C wave.
Pacito
 

Attachments

  • aex.JPG
    aex.JPG
    169.3 KB · Views: 146
  • aex.jpg
    aex.jpg
    283.9 KB · Views: 146
  • dax.jpg
    dax.jpg
    289.7 KB · Views: 157
Last edited:
Donderdag 21 maart

It’s merely a matter of keeping the options open or some would say expect the unexpected. Some called it a relief rally just after the FED decision others would point out the state of the economy has not been changed by it and first quarter results are due. So enough of the fundamental stuff let’s keep our eye on the ball.

To start with we need to capture two scenario’s and take the one for trading today as is proves itself to be correct. Even though it might not look like it from your data the AEX is trending negatively and has been doing so for quite some time, so if we project the first possible trend change we need a close today above 507,82.

Intraday:
On the upside we have a reference that the price is drown towards let’s call it Upr. Now officially the value now is resistance it will become support once the index is opening above it. The downside when it’s due.

Have fun trading today.

09-10u Upr =510,08 SL1 =502,91 SL2 =504,62
10-11u Upr =509,93 SL1 =507,79 SL2 =507,31
Keep an open mind whereas wave 3 is concerned so 4 and 5 in the picture watch the 4 and wave degree.
11-12u Upr =510,06 SL =507,35
12-13u Upr =512,77 SL1 =507,35 SL2 =506,76
Notice that the Derivative Oscillator is performing it’s trick once again.
13-14u Upr =512,46 SL1 =508,22 SL2 =506,62
14-15u Upr =512,31 SL1 =510,08 SL2 =509,78
Updated the chart so look for the clue to come. Chips please note that all the II. after the first one should be III.
15-16u SL1 =506,92 SL2 =506,09 RL1 = 507,96
III:5=III so now IV on it’s way note the change R into S and visa versa.
16-17u SL1 =506,10 SL2 =505,25 RL1 = 507,70
17-Close SL1 =507,17 SL2 =506,25 RL1 = 508,01 RL2 =509,76
 

Attachments

  • aaa2.jpg
    aaa2.jpg
    97.5 KB · Views: 217
  • aaa2.jpg
    aaa2.jpg
    77 KB · Views: 193
Last edited:
Off skiing!

Day Chart
After the expected upward gap we saw an almost perfect doji today, and which can even be called a long-legged doji - typical of trend reversals...but that interpretation first needs confirmation with a downday tomorrow (possibly with a gap) after which it may become a bearish island reversal.
As indicated as a possibility yesterday, today we saw the RSI "breaking" through its resistance line from earlier highs. Due to the doji-form, however, it was not a significant breakthrough yet and tomorrow has to provide confirmation of this. If not (which we expect as a result of the doji-formation), in fact it could confirm exactly the opposite: that it still is a resistance and that the RSI will stay in bear territory which would confirm a bearish trend in the day chart.
The cycle at the day level, however, is still directed upward. We will look at more detailed time frames to see whether it gets support to move further upward.

Hour Chart
Yesterday the cycle was way up with little room to further move upward. It stayed at high levels during the first half of the day, but in the afternoon it then finally started its downturn.
The RSI as well has been way up for days and it again found support from the uptrendline, as it did yesterday. However, after 1 pm it finally fell through this support to go to lower levels. Due to the final moves of the day it did bounce up again still well in bull territory. I expect it to go into bear territiry tomorrow, but possibly not strong enough to leave the bull range.
So from this time frame I expect that the cycle at the day level will stall and will slowly start turning south.

15' Chart
At the 15' level, the cycle stayed up until early afternoon. The drop in the price chart then made the cycle move quickly down until the end of the afternoon. It made a last upmove in the last hour. But although the cycle is climbing, from the form it is clear that it was already turning around again at the end of the session (5:35 pm). It will help the hourly cycle go south and thus stall the cycle at the day level.
The RSI moved in parallel with the cycle and tested the bull support level around 4 pm. It then broke back through the bear resistance giving a mixed signal. But the end of the session clearly showed it was a lower top, making a future bear trend more likely. It will be key that tomorrow we will also see the 15' RSI break under the bull support as did the RSI in the 5' chart a little bit before 3 pm (after having tested it so many times over the last few days).

5' Chart
As said, the 5' finally confirmed a more significant down move at 2:50 pm this afternoon. This sign stayed valid until around 5 pm after which the final rally finished to make a lower top and the cycle turned around for the last half an hour.

Summarized...
As indicated yesterday at the end of the session, the AEX/FTI stayed strong until 2 pm today. Then market sentiment made its turn southward, with the 1' RSI breaking downward at 2:10 pm, finally confirmed by the 5' RSI at 2:50 pm. The move didn't continue however, and only made the 15' RSI test its bull support.
At this moment all signs indicate a downday tomorrow: cycles are mostly directed downward or close to turning that way. The RSI at various time frames has shown weakening signs most of the afternoon, and the rally in the afternoon failed to make a higher top. Together with the candle stick formation, it all indicates a weaker day tomorrow which would confirm the down trendline in the daily RSI chart. This would be an important sign as it would indicate a bear trend at that level.

I am off for a long weekend of skiing in Switzerland... and I'll be back on Tuesday.

Happy trading for the rest!

Stjekel
 
Off course

The line today broke out of my channel. Disaster? Only if it doesn't return inside the channel within 2 days. EOD indicators:
RSI 62,10 close to bull. Volatility 20,68 still rising. Long MACD (default) turns positive. Short MACD is reaching a top. Short stochastics over the top already. If we make a lower close tomorrow, then we have a marginally lower top and can go down further in the trading range 491-510 or even 470=510. The other possibility is of course up. Then 518 comes in sight. I still see a top in June but I'm not convinced that we can reach that without testing bottoms.
Pacito
 

Attachments

  • 1.jpg
    1.jpg
    319.9 KB · Views: 134
  • aex.JPG
    aex.JPG
    168 KB · Views: 136
Last edited:
vrijdag 23 maart.

If there is one thing you should have learned the last couple of day’s it is that a high indicator value is a relative understanding and you urgently need to get your indicator use in perspective. The Brown book loosely hands you out the motherly advise that you should in fact take your tools apart before you use them. I would say don’t use what you don’t understand. So let’s have a look at today’s level playing field and let’s play some darts.

09-10u SL1 =508,51 SL2 =507,68 RL1 =509,71 RL2 =512,10
10-11u SL1 =507,73 SL2 =506,88 RL1 =508,69 RL2 =510,68
11-12u SL1 =509,03 SL2 =508,26 RL1 =510,58 RL2 =512,92
The Derivative Oscillator changed again now making up if IV complete or IV:B
12-13u SL1 =508,93 SL2 =509,71 RL1 =510,56 RL2 =512,74
13-14u SL1 =511,63 SL2 =510,86 RL1 =512,71 RL2 =515,33
Notice the ND for a nice signal with beautiful surrounding (rl2 is within ND)
14-15u SL1 =510,06 SL2 =509,20 RL1 =511,27 RL2 =513,36
chart updated.
16-17u SL1 =513,96 SL2 =513,13 RL1 =515,60 RL2 =518,57
The Derivative Oscillator near zero so alert.
17-Close SL1 =514,02 SL2 =513,19 RL1 =516,33 RL2 =519,34
Don’t gamble just take your money and have a nice weekend.
 

Attachments

  • aaa2.jpg
    aaa2.jpg
    75.4 KB · Views: 189
  • aaa2.jpg
    aaa2.jpg
    59.1 KB · Views: 171
Last edited:
We are back at the top of the broadening formation. Also the RSI is at a maximum value of the last half year. Lets see if this will stop the rise of the AEX.
 

Attachments

  • aex20070323.gif
    aex20070323.gif
    40.5 KB · Views: 173
Oeffff

It just happend in two weeks. We touched the upper line of the widening triangle. Its a bit hard to see if it's still valid because we didn't touch the lower line. Still, if we don't break out of this triangle I suppose it's still valid. We didn't on EOD reach the 61,8 fibonacci of the retreat from 700-217. That can be an important resistance. If we will break this next week then the next target will be 518 and hence 531. If not we can really go down. Just look at the charts.
I won't be there next week to watch all this. So in my next preview I will presumably either talk about the next bottom at 470 or the next high at 530.
I'll go for the first possibility.
Pacito
 

Attachments

  • aex.JPG
    aex.JPG
    167.7 KB · Views: 168
  • aextime.jpg
    aextime.jpg
    318.1 KB · Views: 165
compare indexes

1 The three european indexes showed a lower low, the US indexes didn't.
2 The AEX showed a new high, the rest didn't.
3 If the rest is to set a higher high then the AEX could reach 530 in no time.
4 If the rest doesn't the fall wil be much more spectacular.
The first two are facts. 3 and 4 are speculations.
All on EOD data.
Pacito
 

Attachments

  • aex.jpg
    aex.jpg
    285.5 KB · Views: 141
  • dax.jpg
    dax.jpg
    290 KB · Views: 151
  • cac40.jpg
    cac40.jpg
    301.9 KB · Views: 141
  • dow.jpg
    dow.jpg
    284.4 KB · Views: 142
  • S&P.jpg
    S&P.jpg
    294.3 KB · Views: 144
reo heeft een harde plasser....

a picture speaks a thousend words; my preferred scenario for the short term: we"ve seen the st-top on friday or will see it on monday. don"t think we will get beyond 516. more likely we will be heading down next week. target: 485.
 

Attachments

  • a.png
    a.png
    19.6 KB · Views: 203
effe wat anders en het is nog mooi weer ook.

The last week of the month March the Dutch are busy with the national hobby which is to fill out their income tax form in such a way that the taxes due are close to the absolute minimum, zero. A number of them turn to so-called specialists who claim to know the details but fail to deliver, where have we seen that before, it’s just like the majority of the stock market Analysts. Since I have achieved the absolute maximum it’s my objective to realize it again.

As mentioned last week this is the phase where your indicator knowledge will bring you the up most ROI.

Have fun.
 
Wouter geeft ons een week extra en de zon komt door

The window-dressing fairytales seem to dominate the Bear FUD camp which has awakened from her\his Winter beauty sleep. What people seem to oversee is that once awake the Bear is in desperate need for food using up the last bits of winter supplies. The short term outlook has entered the Bull range and is today focusing on staying within the Range testing the bottom of the range for support and found it up until now anyway.

If we review the MLT outlook from the GJN taught trending methodology with the Dynamic Range Rule RSI the trending mode has been changed from negative into positive and found it’s way in the Bull Range since.

From the Reversal Signal Area it has to be noticed that in several charts active signals are present and I must admit that I am totally shattered that the mere finding of the actual signals seem to be a bridge too far.

Have a nice weekend.


EDIT:
Over the last couple of weeks I have provided a number of quick and dirty R\R statistics for a number of different trade levels. Look at them once again, notice the time\date they were published and refer that to the actual price movement. And now have a look at the new ones for the swing to come: Level 1; Reward 15,64 Risk 0,44 R\R 35,53 times 100 is the percentage for the people who work with 60% R\R figures; Level 2 Reward 9,32 Risk 0,44 making R\R 21,18 time 100 again for the percentage. However Rule number 1 in the Clown’s Trading Almanac instructs you to sell high and buy low.
 
Last edited:
volle maandag

Dear Clown, thanks for your update. indeed nice reversals are noticed, some popped up after the low early march with challenging targets like f.i. 564,9 on the hourly chart, confirmed on the daily/weekly timeframes with lower targets...interesting for the long term trading positions.
More interesting for the shorter term are the ones starting mid last week, depending the timeframe with targets up to 530, confirmed in the daily with lower target....with the words of Connie a nice present...
Still working on improving validation criteria, and (GJN) +/- trending confirmations, which I think are not so clear / simple as you seem to advocate..

The R/R system you refer to is something I will dig into to learn more about, thanks for sharing thusfar.
 
Week 14.

One of the things I resent the most about the description mob is the need to look back in each and every peace they publish with the pink glasses look trying to convince primarily themselves how good the were. Even the one Analyst I do respect for what he has accomplished has that need in an adaptive local form. It’s only recently that I have grown to understand a bit where that itch is coming from when some individuals misused the anonymous Dutch forum to have a go at my alias. Since I did not turn the other cheek I just hit them back a bit harder by announcing and performing a trade to win against the general sentiment live last Friday. What can I say, it was fun. Let me just repeat my trading adagium, A trader is as good as his NEXT trade.

The weekly outlook has not changed from an Elliott point of view and remains positive on six out of the six utilized wave levels. My skepticism towards the best scoring wave count remains since the very same arguments are valid and will stay in the back of my mind in order to connect when appropriate. The actual flow, trend, swing or what you would like to call it points upwards so until proven otherwise follow the money. Last weeks data gave us a new high at 515,86 and the best scoring Elliott pattern starting at 469,85 proclaims the new high as a wave III and the next performance implicitly as IV with A on 503 and B on 514,46 subsequently wave C downwards which completes the IV with the 38,3% just below the 500. Let me spare you the details on specific wave counts and inter wave relations just the conclusion that there is enough to motivate the conclusion that wave III on 515,86 will be moved up this coming week.

From the Technical Analysis New School Reversal (positive and negative) front there is much activity going on in many different charts. Last week I challenged you to do some reversal finding yourselves and Quick (thanks for your contribution) responded with a number of different signals and targets. Since this thread is not for passive consumption but primarily for educational purposes I am not going to feed you with the specifics if you really want to learn you will have to invest. The first thing is to find the actual signals in the charts and forget about the validation just work with the things provided by the signals and coincidently (really?!) those things are identical to what a trader needs 1) direction 2) target 3) exit or stop-loss. Don’t worry be happy, one of the active signals is in sync with the above mentioned wave III change.

The month March has been completed and the first Quarter is history as well so we are entering a new period of numbers and expectations with the associated primary emotions that drive the markets. So it’s the moment to review the trending scenery on the related timeframes connected to 217,80 ; 307,31 and 470,54. The 217,80 trending scenery is still going strong without any serious testing (yet) of the bottom as you might recall from previous outlooks I have two Long Term (LT) 217,80 KVKD trending area options and in the less bullish of the two the midpoint served as support successfully for the early 2007 correction. The 307,31 KVKD (MLT)trending area is showing the level of correction since the bottom of the area functioned successfully as support and turned the AEX correction. At this point the AEX is well in the upper side of that trending area. The 470,54 KVKD (MST)trending area (mind you this is the December 2006 one) was: left downwards on February 28, entered on March 22, left on March 27 and the AEX tried to get in unsuccessfully last Friday even only by the last two data Ticks. We have an interesting phase ahead of us.

Last weekly I attached an Astro finance chart which presents the longer term cycle bear influence which strikes me while it is presenting area’s in time to be alert for bear performance in the index. Well you might have guessed and you are right there is a bull one as well and again it strikes me just by looking at it projected in the actual AEX data chart. Mind you it is not yet up to the level I want it to be however I zoomed in and attached both bear (first one) and bull (second one) chart for the months March, April and May. If you recall the bear chart in the last weekly and combine the two attached here you might imagine my astonishment when I put in the actual AEX data. The reason I put up the two charts this week with the given time period is found if you compare the two and look at the first part of the month May. My trading days as a fundamentalist are in the past however that doesn’t mean I threw it all away and therefore am extremely excited to learn what the day 9th of May will bring.

For months and months and months the specialists have told us about the 4 years Cycle which was going to disturb our nice stockmarket rally and bring serious crash like scenario’s even the year 1929 (and some others) popped up here and there. So the Yanks oriented part of the community acting like the typical Joe Six-pack focused on October 2006 and once new all time high DJIA values were scored and time went by forgot all about the 4 years Cycle. This is the part where the people who think distinct themselves from the mere followers and subsequently the way how you think.

The 4 years Cycle arguments you can find in my previous posts even threads of last year. So let’s now throw some statistics and look at a DJIA data file starting in 1897 that’s the reference data. In that data file we can find 28 completed 4 year Cycles so we can calculate whatever we would like but let’s look at the average decline from the high which is 33,48% with a spread from 9,68% to 86,05% and the average time between that high and low is 11,28 months with a spread of 1,54 to 32,85 months. It should not be that difficult to do your own math’s as to where we are presently in the DJIA. The AEX will not follow the exact DJIA route however the more substantial movements will be found without a shadow of doubt. In all honestly I admit not having compiled the above statistics myself but just borrowed them from the net it’s not the exact figure it’s the line of thinking that makes the difference.

To wrap this weekly up I urge you to have a look at the second chart that was attached to the first post in this thread. And to avoid to blown my own horn too much I would like you to include the similar charts Pacito has put up since including the recent ones.

Have fun trading this week.
 

Attachments

  • aaa.jpg
    aaa.jpg
    129 KB · Views: 231
  • aaa1.jpg
    aaa1.jpg
    143.6 KB · Views: 224
Gras voor de voeten..............

As clown said most of it already I will only consider some other points of looking at it.
First candlesticks. We ended with a doji. Long shadow on the upper side which means that the bears are vehemently striking back. Nevertheless no winners. Due to this long upper shadow a bearish harami went lost.(-)

Second the RSI. In my opinion the RSI comes from a bearish range and has not succeeded in passing the 65 for bullish territory. So still in bearrange.(-)

Third the big triangle. Since the AEX is still in this triangle I can't rule out the possibility that we will test the bottom line. However, the longer it takes, the lower the bottom.(+/-)

Fourth the gap from 500,89-503 is still open. There's also a tiny gap from 485,70-486,97 that's still open. (-)

Fifth the EB indicator gave a buysignal on 22-3 and is still positive. (+)

Sixth MACD 3,5,3 still sinking. (-)

Seventh Stochastics 5,3,3 didn't turn yet. (-)

Eighth the DMI is positive. (+)

So from my eight points there are 5 negative ones, 2 positive ones and 1 undecisive.
Together with clown's 6 out of 6, we have 7 positives and 5 negatives. That's what the doji said.
Pacito
 

Attachments

  • aex.JPG
    aex.JPG
    172.7 KB · Views: 167
Thanks Clown for your update.

My own opinion (replies appreciated)

daily chart: RSI didn't set new highs since december 06. In bearterritory.

If, however, we going to look on the hourly chart; we see a bull-range. A slight dip around the 28th of March, but still positive
 
Top