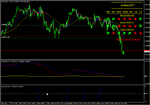
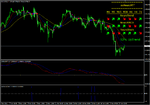
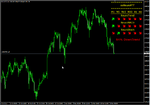
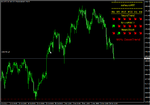
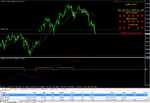
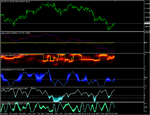
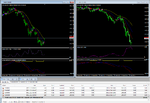
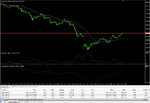
Here I would like to show you a concept of multi time frame indicators:
- This indicator is based on several predicted indicators (can be combination of 1, 2, 3 or more indicators)
- Each predicted indicator will be calculated on several time frame (5M, 15M, 30M, H1, H4 and D)
- Each indicator on a single time frame will be presented as an arrow (green for an uptrend and red for a downtrend)
- Calculate a percentage for overall trend, if we have 5 downtrend and 16 uptrend out of 21 (total) then overall will be about 76% uptrend
This overall percentage calculation will be used as trade entry base. So far seems better than a single time frame analysis.

