Anybody know about VantagePoint's Intermarket Anaylisis?
As explained in the book "Trend Forecasting with Technical Analysis" by Louis Mendelsohn, intermarket analysis provide more precise trading strategies.
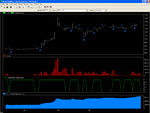
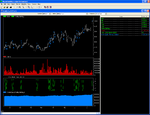
Based on given inputs, there 5 Neural Networks are produced: 1. predicted 1 bar high (PHigh), 2. predicted 1 bar low (Plow), 3. predicted short term 2 bar SMA5 (PTS), 4. predicted medium term 4 bars SMA10 (PTM), 5. Neural Index (based on difference between predicted 1bar and actual SMA3).
Additional indicators PTS Diff (PTS-actual SMA5) and PTM Diff (PTM-actual SMA10), PHigh Diff (PHigh - High) and PLow Diff(PLow-Low). Unfortunately, I could not found how to get "Strength Index".
Neural Network Inputs: for EURUSD chart daily.
Open,High,Low,Close,Volume,AUDJPY, AUDUSD, EURCAD,GBPJPY, GBPUSD,,^DJI, ^DJT, ^DJU, Nasdaq-100, FTSE 100. I could not include Oil, USD Index, T-Notes as mentioned in the book, due to unavailability data from MT4.
Neural Network outputs:
Lead(High,1), Lead(Low,1), Lead(Avg(Close,5),2), Lead(Avg(Close,10),4) Lead(Avg(Close,3),1)
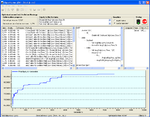
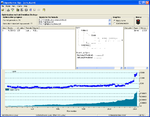
NN design using back propagation.
The book explain how to use these indicators, such as:
- Buy when PTS Diff or PTM Diff turns positive and sell when PTS DIff or PTM Diff turns negative.
- Buy when PTS cross above TrendS or PTM cross above TrendM and sell when reverse
- Buy when PTS cross above PTM and sell when reverse
- Buy when Neural index 1 and sell when 0.
Higher probability to be used for trading, i.e. when all indicators are in confluence.


