Build Neural Network Indicator in MT4 using Neuroshell

Proteus.. Thanks for your insight. Have you tried to use your indicator in an EA? Any suggestions?

Also, have you selected your out of sample sets from the period after the training period, or are they randomly selected from inside the training period?

For Arryex.. Proteus determines the percents quoted by counting the number of predicted and true signs that match. In other words if his MACD indicator predicts that the signal will go up, then x% of the time it will really go up. He does not quote RMSE, though he must have measured it.
 
Last edited:
Thanks for the link Fralo,

I am looking for self trained neural network( retraining on every bar or someting close) like similar to neuroshell's adaptive turboprob oradaptive nets.Is sliding window concept the sma thing http://www.forexfactory.com/showpost.php?p=3783638&postcount=2 thanks.

There are several methods for updating, or adapting different classifiers. On line algorithms for the SVM/SVR can be found here http://onlinesvr.altervista.org/

The KNN classifier is easily adapted by dropping the oldest data and adding the newest.

There seems to be a lot going on using ensembles of classifiers. This is typical, but there's a lot more
http://www2.imperial.ac.uk/~gmontana and here /http://www.ymer.org/amir/2010/04/18/online-multi-class-lpboost-code/

There may be incremental, or online algorithms for perceptrons, but I am unaware of those. Anyone with information on these please post.
 
fralo, you are right in what you said so far. There's no EA at this point, the dev group is focused right now in creating a few more indicators on the same idea (rsi, stochastics) and after that we may build an EA using all of them.

The sample sets are from the period after the training period, there would be no point otherwise, the test would be flawed. There's separate test data and training data.
RMSE wasn't calculated. What we calculated was the average error (predicted - expected) for all the test points and that was pretty small (you can see in the screenshots, the predicted values are almost the same as the real ones). It's not quoted because of a few reasons:

- It differs with each pair, some perform better than others; You need to think out of the box - this is true for any algorithm that you use; it's not all about the RMSE. Take all kinds of different measurements and keep them, analyze them. You never know where you will strike gold.

- Same error on timeframe M1 is a huge deal compared to H1 due to the smaller timeframe. Think big. AI algorithms or genetic algorithms are not about precision. They are about pattern recognition and classification. Take what you can get and transform it into a way that you can use it. Take advantage of even the smallest thing. It doesn't have to be perfect.

- Because it was meant as a manual trading system, the value doesn't matter as much; what matters is that you can see the MACD direction. Think about it this way: if you know that next bar price goes down, does it really matter how much ? Take 1 pip, then repeat on the next bar. Do this for 100.000 bars. You're rich. Congrats! :)
 
- Because it was meant as a manual trading system, the value doesn't matter as much; what matters is that you can see the MACD direction. Think about it this way: if you know that next bar price goes down, does it really matter how much ? Take 1 pip, then repeat on the next bar. Do this for 100.000 bars. You're rich. Congrats! :)
As a matter of fact it does really matter how much. If it goes down 1pip and you have shorted, you will lose because of spread and commission. If it didn't matter then it would be a simple matter to write an EA, and with 90% accuracy in direction you could become rich. Part of the problem is whipsaw. It might be that your ability to predict direction in 5 bars will help this, but only if one could have some idea of how much the price will change....Incidentally, knowing the direction of the signal line in the MACD is not the same as knowing the direction of the next bar, since MACD is smooth and lags price changes (rough), usually by more than one bar.

I agree that the rmse is not the only or the best measure, since it depends a lot on how you use the indicator. But until you do use it, you need to know things like rmse. Even better would be a histogram of the errors.

The proof of the pudding is in the eating. e.g. I have a NN based indicator to predict the next bar high and next bar low. On EUH1 it has a directional accuracy of ~95%, and an rmse of 12.5 pips; however, I have found no way to write an EA that exploits this prediction. A main problem is that even good prediction of direction of high and low is not enough when the rmse is half of the typical range. Furthermore, the prediction accuracy is an average measure, and the direction may be wrong precisely when the price trend is changing. Since these changes occur less often than no change, directional accuracy may not help as much as we would like.:(

If someone has an idea how to use this indicator PM me. I will share for free. But I will not keep it up to date. :)
 
Last edited:
fralo, I know it matters how much the price changes, not only the direction, but I think we can agree that price changes more than 1 pip, as long as we're talking time frames larger than M1, therefore generally you can cover spreads, especially if you use an ECN broker with <2 pips spread.

About your indi, 12.5 pips is an error way too high to be usable and besides you're trying to predict price. Proteus 5 is all about MACD, which is much easier to use in an EA, especially if it's combined with RSI, stochastics, bollinger bands etc. Just wait until we're done building those indicators, you'll feel that you live in the future.

Neural networks don't work with *everything*, you must know how to apply them and to what. You cannot predict raindrops but you can predict weather patterns on a global scale. That does help you in staying out of the hurricane's path, doesn't it? The same way, you cannot apply them on something like price, which changes so very often and depends on even the slightest economic news; you need to apply them to something bigger.

And as long as we're on the subject, clustering techniques are also worth having a look. Just so you'd know, it helps classifying the current market trend very well.
 
Last edited by a moderator:
fralo, I know it matters how much the price changes, not only the direction, but I think we can agree that price changes more than 1 pip, as long as we're talking time frames larger than M1, therefore generally you can cover spreads, especially if you use an ECN broker with <2 pips spread.

About your indi, 12.5 pips is an error way too high to be usable and besides you're trying to predict price. Proteus 5 is all about MACD, which is much easier to use in an EA, especially if it's combined with RSI, stochastics, bollinger bands etc. Just wait until we're done building those indicators, you'll feel that you live in the future.

Neural networks don't work with *everything*, you must know how to apply them and to what. You cannot predict raindrops but you can predict weather patterns on a global scale. That does help you in staying out of the hurricane's path, doesn't it? The same way, you cannot apply them on something like price, which changes so very often and depends on even the slightest economic news; you need to apply them to something bigger.

And as long as we're on the subject, clustering techniques are also worth having a look. Just so you'd know, it helps classifying the current market trend very well.

I love your posts. Than let's wait till you will post results of any strategy using your indicators :D

Otherwise such discussions are disconnected from reality
 
There may be incremental, or online algorithms for perceptrons, but I am unaware of those. Anyone with information on these please post.

online perceptron and others.... like this name 'banditron'

http://dogma.sourceforge.net/index.html#about


% Online classification algorithms.
% banditron_multi_train - Banditron
% k_alma2_train - Kernel Approximate Maximal Margin Algorithm, with the 2-norm
% k_forgetron_st_train - Kernel Forgetron, 'self-tuned' variant
% k_oisvm_train - Kernel Online Independent SVM
% k_om2_multi_train - Kernel Online Multi-class Multi-kernel Learning
% k_om2_mp_multi_train - Kernel Online Multi-class Multi-kernel Learning, multiple passes
% k_omcl_multi_train - Kernel Online Multi Cue Learning multiclass
% k_pa_train - Kernel Passive-Aggressive, PA-I and PA-II variants
% k_pa_multi_train - Kernel Passive-Aggressive multiclass, PA-I and PA-II variants
% k_perceptron_train - Kernel Perceptron/Random Budget Perceptron
% k_perceptron_multi_train - Kernel Perceptron/Random Budget Perceptron multiclass
% k_projectron_train - Kernel Projectron
% k_projectron2_train - Kernel Projectron++
% k_projectron2_multi_train - Kernel Projectron++ multiclass
% k_sop_train - Kernel Second-order Perceptron
% pa_train - Passive-Aggressive, PA-I and PA-II variants
% pa_multi_train - Passive-Aggressive multiclass, PA-I and PA-II variants
% perceptron_train - Perceptron
% pnorm_train - p-Norm
% sop_train - Second-order Perceptron
% sop_adapt_train - Kernel Second-order Perceptron, adaptive version
%
% Online optimization algorithms.
% k_pegasos_train - Kernel Pegasos
% k_obscure_train - Online-Batch Strongly Convex mUlti kErnel leaRning
% k_obscure_online_train - Online-Batch Strongly Convex mUlti kErnel leaRning - 1st phase
% k_obscure_batch_train - Online-Batch Strongly Convex mUlti kErnel leaRning - 2nd phase
%
% Selective sampling algorithms.
% k_sel_perc_train - Kernel Selective Perceptron
% k_sel_ada_perc_train - Kernel Selective Perceptron with Adaptive Sampling
% k_ssmd_train - Kernel Selective Sampling Mistake Driven
%
% Auxiliary functions.
% model_init - General inizializiation function
% model_predict - General prediction function
% model_mc_init - Inizializiation function for Multi Cue Learning
%
% Miscellaneous.
% compute_kernel - Calculate the kernel values
% shuffledata - Shuffle input and output data
% demo - Demo of many classification algorithms
% randnorm - Sample from multivariate normal
 
Hi Proteus,

On what basis that you choose predicted MACD with setting 20,200,20 and 5 bar in advance? To measure whether it will generate a profitable trade you should test it using EA or other tools.

Here I will show you that using other parameters on MACD setting can get more profitable trade, leading 5 bars predicted value in the future are used for both trading strategy. The data used is EURUSD 60 minutes chart (about 70,500 bars from 199.01.04 12:00 to 2010.05.07 23:00). For this data, Crossover trade between Lead 5 bars of MACD(12, 26) and MACD signal (12,26,9) almost get twice profit than Lead 5 bars of MACD(20,200) and MACD signal (20,200,20), see the trade detail comparison.

Otherwise might be getting more difficult to predict MACD(12,26,9) rather than MACD(20,200,20).:)

Arryex
 

Attachments

  • Lead 5 bars MACD.png
    Lead 5 bars MACD.png
    26.6 KB · Views: 1,278
  • Lead 5 bars MACD 12-26-9 trade statistic.png
    Lead 5 bars MACD 12-26-9 trade statistic.png
    27.4 KB · Views: 646
  • Lead 5 bars MACD 20-200-20 trad statistic.png
    Lead 5 bars MACD 20-200-20 trad statistic.png
    27.2 KB · Views: 464
Hi Proteus,

On what basis that you choose predicted MACD with setting 20,200,20 and 5 bar in advance? To measure whether it will generate a profitable trade you should test it using EA or other tools.

Here I will show you that using other parameters on MACD setting can get more profitable trade, leading 5 bars predicted value in the future are used for both trading strategy. The data used is EURUSD 60 minutes chart (about 70,500 bars from 199.01.04 12:00 to 2010.05.07 23:00). For this data, Crossover trade between Lead 5 bars of MACD(12, 26) and MACD signal (12,26,9) almost get twice profit than Lead 5 bars of MACD(20,200) and MACD signal (20,200,20), see the trade detail comparison.

Otherwise might be getting more difficult to predict MACD(12,26,9) rather than MACD(20,200,20).:)
Arryex
As I've said previously, trying to predict price or indicators with small periods is like trying to predict raindrops; they respond too quickly to economic news, it's imposible. Predictions will be available for MACD(12,26,9) soon, as those values are very commonly used, but they probably won't have 90% accuracy. It remains to be seen though, I'm keeping my hopes up; the networks are currently being optimized to find the best parameters.
My advice to you would be to apply your algorithms to bigger time frames and periods. The profit might be smaller with (20,200,20) than with (12,26,9), but at least it's a profit that you can easily take.

Clearly smoother curves are easier to predict than less smooth. You can predict a straight line perfectly forever, given only 2 samples. Have you compared your MACD predictor with a simple linear or polynomial predictor? Those might have just as good performance when the performance measure is the sign accuracy. They are usually very good so long as the direction does not change too rapidly, or at pivot points.. unfortunately the pivot points are precisely where accuracy is required. Incidentally, linear predictors often make good inputs to NN predictors.

Using a predicted MACD in the crossover strategy depends on prediction of crossovers. It makes no difference how accurately you predict the sign of the signal line. Most MACD predictors suffer from predicting too many crossovers. These cause whipsaws and degrade profit. Predicting crossovers late will also cause problems. Better measures of the performance of a MACD predictor would be a count of excess crossovers, and a measure of late crossovers. Have you done this?

You say that changing TF's will make profits more easily. Have you any evidence of this claim?
 
Hi Proteus,

On what basis that you choose predicted MACD with setting 20,200,20 and 5 bar in advance? To measure whether it will generate a profitable trade you should test it using EA or other tools.

Here I will show you that using other parameters on MACD setting can get more profitable trade, leading 5 bars predicted value in the future are used for both trading strategy. The data used is EURUSD 60 minutes chart (about 70,500 bars from 199.01.04 12:00 to 2010.05.07 23:00). For this data, Crossover trade between Lead 5 bars of MACD(12, 26) and MACD signal (12,26,9) almost get twice profit than Lead 5 bars of MACD(20,200) and MACD signal (20,200,20), see the trade detail comparison.

Otherwise might be getting more difficult to predict MACD(12,26,9) rather than MACD(20,200,20).:)

Arryex

Arry,

Are you using LEAD from NS in trading strategy ?? Its not allowed to use it in trading
strategy - see NS help. It falsifies the results (future leak)
 
Kryzs,

I use it just to find the best lead values that i should predict after. The point is we do not need to wasting time to predict led values which are not profitable or too much whipsaw.

Arry
 
Hi All,

While waiting Proteus displaying the benefits of his predicted MACD on EA, here I would like to shown you my own prediction with the trading strategy using NSDT.

As attached pictures, I did the following:
- Simply made predict the MACD and MACD signal
- Create trading strategy based on predicted signals
- Make a similar one in NS2 to make indicator in MT4

As the NSDT result:
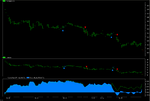
1. Using predicted MACDs outperform compare to traditional one, especially on out of sample data. (see picture 1a and 1b)
2. 14.7% compare to 35.8% 1 year return on trade (see picture 2a and 2b)
3. Detail trade analysis for both trading strategy (see picture 3a & 3b)
4. Comparison of predicted data series and its trading signal (picture 4)
5. Detail predicted future values (picture 5)

3 month EURUSD hourly data used for training and out of sample started from 1st October.

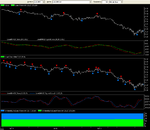
On MT4, I made also other predictions :SMA upper chart (aaNeurotrend) and MACD (aaNeuroMACD)using Neuroshell2. Both are compared with original MACD and Proteus 5 including the 5 bar future values(see picture 6).

I have seen that on Proteus indicator, the past predicted value always be overwritten with the real MACD/MACD signals (repainted), accordingly I could not see the past comparison between predicted and real signal.

Arry
 

Attachments

  • 3a. Detail analysis MACD.png
    3a. Detail analysis MACD.png
    26.7 KB · Views: 430
  • 2b. TS Predicted MACD.png
    2b. TS Predicted MACD.png
    15.4 KB · Views: 408
  • 2a. TS MACD.png
    2a. TS MACD.png
    15.1 KB · Views: 416
  • 1b. Detail comparison normal MACD and predicted MACD.png
    1b. Detail comparison normal MACD and predicted MACD.png
    18 KB · Views: 662
  • 1a.Predicted MACD outperform normal MACD.png
    1a.Predicted MACD outperform normal MACD.png
    40.4 KB · Views: 830
  • 3b. Detail analysis predicted MACD.png
    3b. Detail analysis predicted MACD.png
    26.7 KB · Views: 392
  • 4. Predicted MACD data series and trade signal.png
    4. Predicted MACD data series and trade signal.png
    33.4 KB · Views: 685
  • 5. Detail predicted future values.png
    5. Detail predicted future values.png
    23.7 KB · Views: 559
  • 6. Detail aaNeurotrend, aaNeuroMACD using NS2 prediction and Proteus 5 compare to MACD.png
    6. Detail aaNeurotrend, aaNeuroMACD using NS2 prediction and Proteus 5 compare to MACD.png
    21.9 KB · Views: 632
Last edited:
Hi All,

While waiting Proteus displaying the benefits of his predicted MACD on EA, here I would like to shown you my own prediction with the trading strategy using NSDT.

As attached pictures, I did the following:
- Simply made predict the MACD and MACD signal
- Create trading strategy based on predicted signals
- Make a similar one in NS2 to make indicator in MT4

As the NSDT result:
1. Using predicted MACDs outperform compare to traditional one, especially on out of sample data. (see picture 1a and 1b)
2. 14.7% compare to 35.8% 1 year return on trade (see picture 2a and 2b)
3. Detail trade analysis for both trading strategy (see picture 3a & 3b)
4. Comparison of predicted data series and its trading signal (picture 4)
5. Detail predicted future values (picture 5)

3 month EURUSD hourly data used for training and out of sample started from 1st October.

On MT4, I made also other predictions :SMA upper chart (aaNeurotrend) and MACD (aaNeuroMACD)using Neuroshell2. Both are compared with original MACD and Proteus 5 including the 5 bar future values(see picture 6).

I have seen that on Proteus indicator, the past predicted value always be overwritten with the real MACD/MACD signals (repainted), accordingly I could not see the past comparison between predicted and real signal.

Arry

i think number of trades is not enough to make any conclusion. From statistic minimal number of samples to have guaranteed Gauss distribution is 30 but for finance time series due to high variance must be more like 100. Sadly NS is not able to make automatic Walk Forward to have more OOS trades.

Krzysztof
 
Hi Kryzs,

We will see after it generating some trades, let say if one trade generated very 5 to 10 hours, if you need 100 trades, then minimum 40 days we need.

Please advice which software that can generate automatic walk forward test to make OOS. The data generated is it an artificial one or selected randomly from previous data?

Using NS I can do it but remake it using very old data and test the OOS for long period.

Arry
 
Hi,

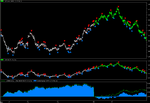
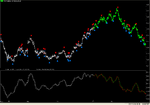
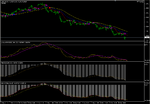
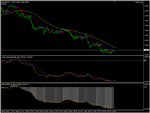
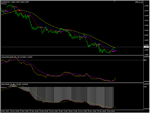
This is another sample of chart to indicate that Proteus is repainted indicator, the past value of proteus is repainted with actual/real MACDs.

On the first picture, predicted MACD and MACD signal are almost at the same place, but after few hours the prediction s changed/repainted.

Proteus, as one of your client I need your explanation.

thank you
Arry
 

Attachments

  • Proteus 1.PNG
    Proteus 1.PNG
    54.5 KB · Views: 392
  • Proteus 2.PNG
    Proteus 2.PNG
    55.1 KB · Views: 1,851
Hi Kryzs,

We will see after it generating some trades, let say if one trade generated very 5 to 10 hours, if you need 100 trades, then minimum 40 days we need.

Please advice which software that can generate automatic walk forward test to make OOS. The data generated is it an artificial one or selected randomly from previous data?

Using NS I can do it but remake it using very old data and test the OOS for long period.

Arry

Multicharts can do it. You just specifying the start date, number of IS bars and OOS bars
and it slides with OOS bars window like an indicator, reoptimize on every slide and made summary report.

So you can do it using MC automatically or NS manually. MC is much better than NS but
in this case you have to learn a new platform and its as always painful at the beginning.

Krzysztof
 
Hi,

This is another sample of chart to indicate that Proteus is repainted indicator, the past value of proteus is repainted with actual/real MACDs.

On the first picture, predicted MACD and MACD signal are almost at the same place, but after few hours the prediction s changed/repainted.

Proteus, as one of your client I need your explanation.

thank you
Arry

or straight away lawyer and to the court because of cheating the customers with repainted results
 
He is coming to this thread like a professional trader, acting like an experience guy, then we serve him as professional as well.

So beware to come to this forum to sell something bad ..you will not get higher selling but you will loose all yours..integrity, your market and your self...

I want to see more of his comments ... :mad: and then...:sleep:
 
Top